AI-built dashboards,
inside your product.
Your users ask a question; Vibedasher builds the dashboard against a real ETL + query engine. Ship it two ways — paste one iframe, or eject it into your own code via the SDK. Rent the engine, own the frontend.
Embed in one snippet
Public dashboards drop in with plain HTML today. Sign per-viewer embeds server-side — or eject the whole dashboard into your own codebase, wired to the SDK.
<iframe
  src="https://cloud.vibedasher.com/v/YOUR-DASHBOARD"
  width="100%"
  height="600"
  frameborder="0"
></iframe>
Public dashboards embed with a single iframe — no SDK, no build step. This exact snippet works in production right now.
See it live on a real siteOne engine, two front doors
Vibedasher is headless BI: rent the data engine, own the frontend. Ship a dashboard the zero-code way, or eject it into your own codebase.
Iframe embed
Paste one snippet and the dashboard renders — hosted, served and kept fresh by us.
For existing sites and non-developers who want analytics live in minutes.
- One iframe tag, no build step
- We host, render and serve every chart
- Signed, per-viewer embeds for private data
Eject to your codebase
Your AI pulls the dashboard into your app via the Vibedasher MCP and rebuilds it natively, wired to the SDK.
For developers who want the dashboard as real code inside their product.
- Recreate it in your stack with Claude Code or Cursor
- You host the frontend; we run only the engine (ETL + query)
- Pay-as-you-go on engine usage, not dashboard views
The moat is the engine: the ETL and query pipeline is the part you can't vibecode. Rent it — own everything else.
A real Vibedasher embed
Everything below is served by our engine in real time — the same iframe snippet from above, running in production.
This chart is a live Vibedasher embed — running on a real cruise-agency site.
Open the dashboard in a new tabType a prompt. Watch it build.
Describe what you want in plain language and see a real chart appear in seconds.
From data to dashboard in minutes
No drag-and-drop, no manual config — just describe what you want.
Connect your data
Pick a source — database, CSV, or cloud warehouse. One click and you're in.
Describe what you want
Type or speak a prompt. The AI writes the SQL and builds your chart.
Publish & share
Share a live link or embed the dashboard on any website with a single snippet.
Real dashboards, built by AI
From a plain-language prompt to a fully interactive dashboard — in minutes. No drag-and-drop, no manual config.
The AI agent writes SQL, picks chart types, and assembles the full dashboard — no manual steps.
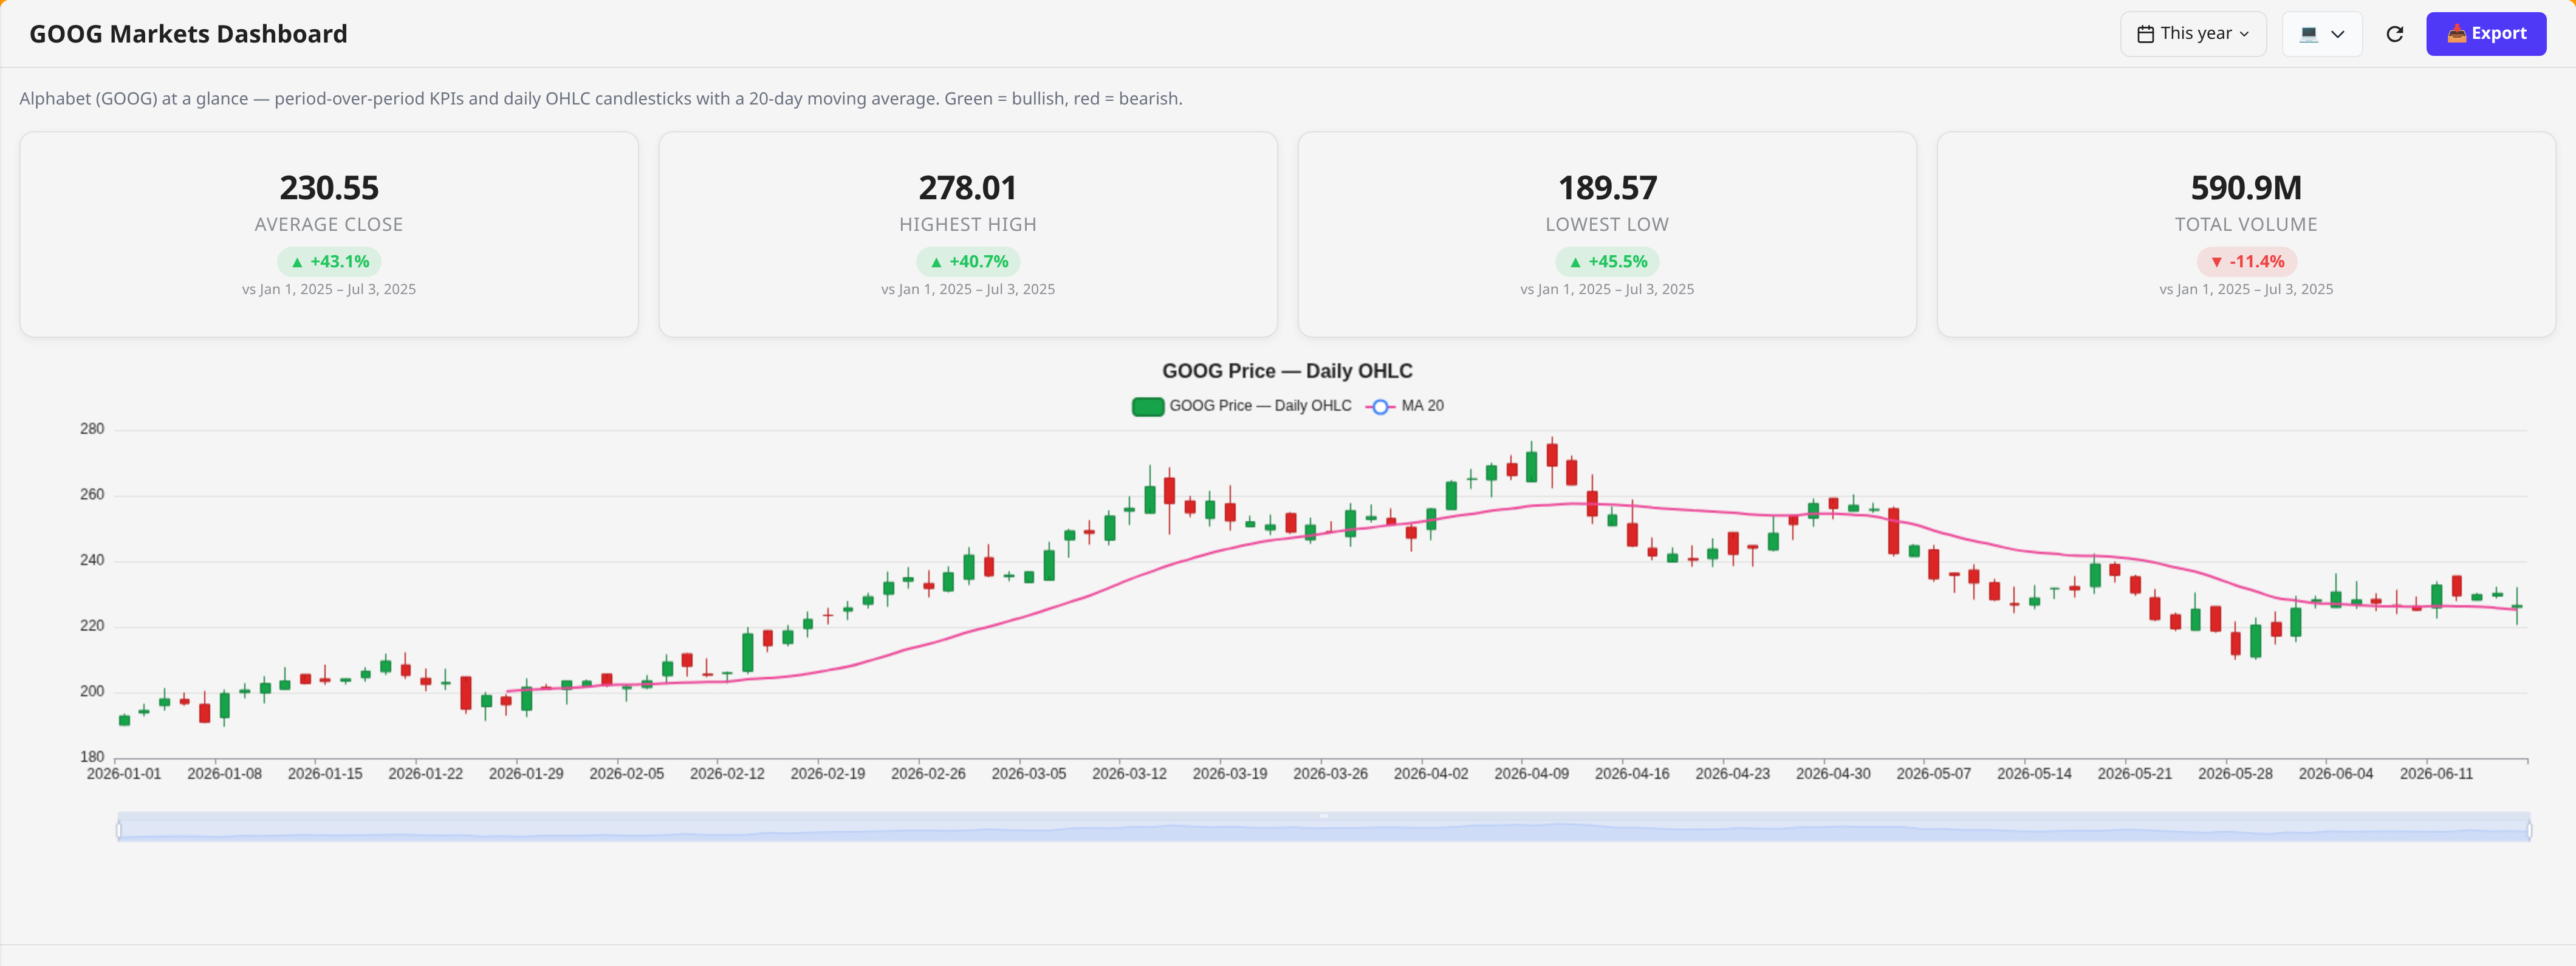
A markets dashboard for Alphabet stock — period-over-period KPI cards and daily OHLC candlesticks with a 20-day moving-average overlay. Advanced chart types, generated entirely by AI.
No credit card required · Free to start
The whole embed stack, included
Signed embeds, your branding, and the data pipeline underneath — the parts you can't vibe-code yourself.
Signed, secure embeds
Drop a dashboard into your app with one iframe or one SDK call. Signed tokens scope every viewer to their own rows — no data leaks between your customers.
Themed to match your brand
Colors, fonts, and layout inherit your product's look. Per-account and per-dashboard theming, so the embed feels native — not bolted on.
Headless data API
Want to render it yourself? Run any saved query and get clean JSON back over a single API key. Charts optional, pipeline included.
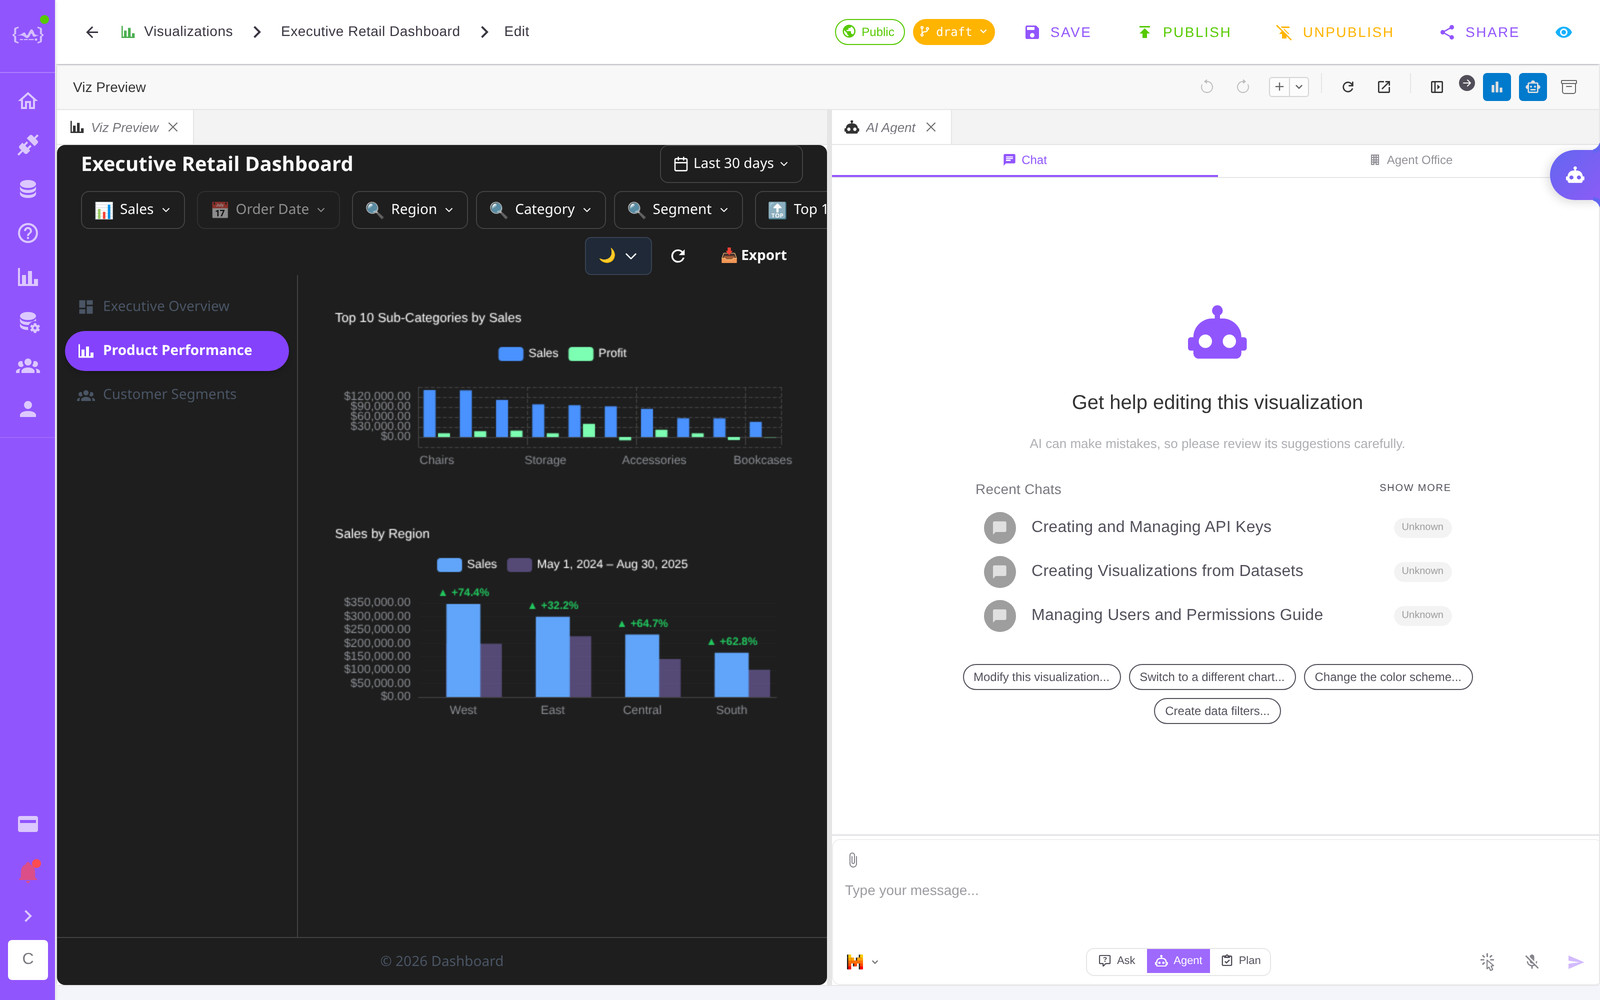
Your users ask, AI builds
The differentiator: your users describe what they want in plain language and Vibedasher builds the dashboard live. No widget config, no BI team.
ETL + query engine included
The part AI can't generate for you: ingest CSVs, databases, and warehouses, then query them fast. The whole data pipeline ships with the embed.
Self-host the whole engine
Run Vibedasher on your own infra with your own LLM. Air-gapped, your data never leaves your perimeter — the enterprise embed tier.
Every Chart Type You Need
Click a chart type to see a live preview — all generated by AI from plain language.
Bar
Best for: comparing discrete categories side-by-side — sales by region, revenue by product.
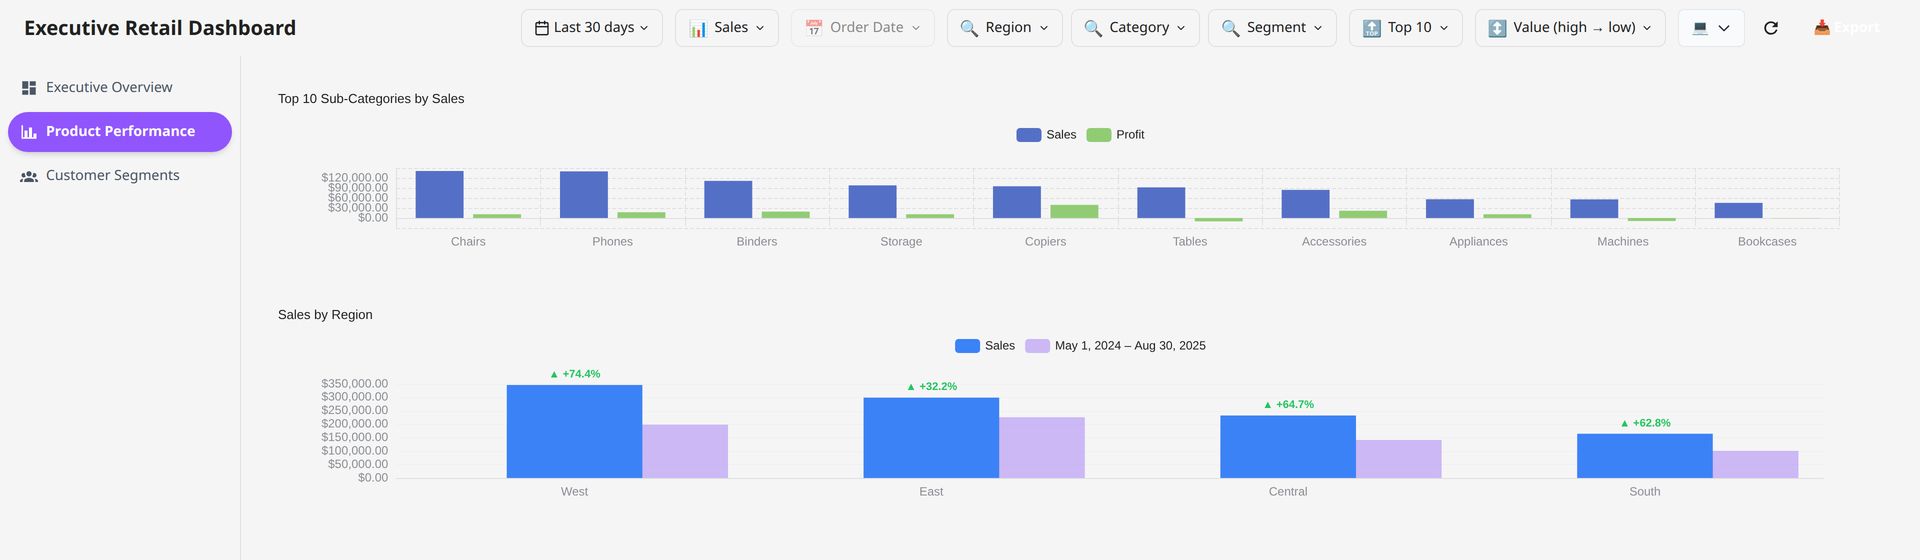
Your dashboard, inside their product
This is what your users get: a Vibedasher dashboard rendered right inside your app — same sidebar, same brand, no context-switch, no second login.
A styled mockup of an embedded Vibedasher dashboard living inside a host SaaS. This one is a static illustration — the real, live iframe embed is shown earlier on the page.
Who ships with Vibedasher
SaaS teams embedding analytics, agencies building for clients, and the analysts who started it all.
Embedded analytics for your SaaS
Give your users dashboards inside your product. Signed embeds scope each customer to their own data. Ship it in days, not quarters.
Dashboards for your clients' websites
Build a data dashboard for each client, themed to their brand, and embed it straight into their site. One account, many client dashboards.
Revenue & growth reporting
Weekly sales reviews, ARR dashboards, and funnel analysis — built by AI and refreshed automatically from your data warehouse.
Self-hosted analytics for regulated data
Healthcare, finance, or government data that can't leave your perimeter. Deploy on-premise with your own LLM, air-gap included.
Ad-hoc data exploration
No ticket, no waiting on the BI team. Ask a question in plain language and get an interactive chart in seconds.
Connect to Everything
50+ integrations and counting
Databases
Cloud Providers
AI Providers
Data Sources
Marketing & CRM
Ready to Transform Your Data?
Start building dashboards in minutes — no credit card required
No credit card required