Apple, up 44% with a 19% hole in the middle
Apple daily OHLCV, dividend-adjusted · 2015–2017 · 506 trading days
Two years of Apple price data, published public. One query fetches a 33 KB Parquet extract; the window is closed, so the data stays as of 2017-02-16.
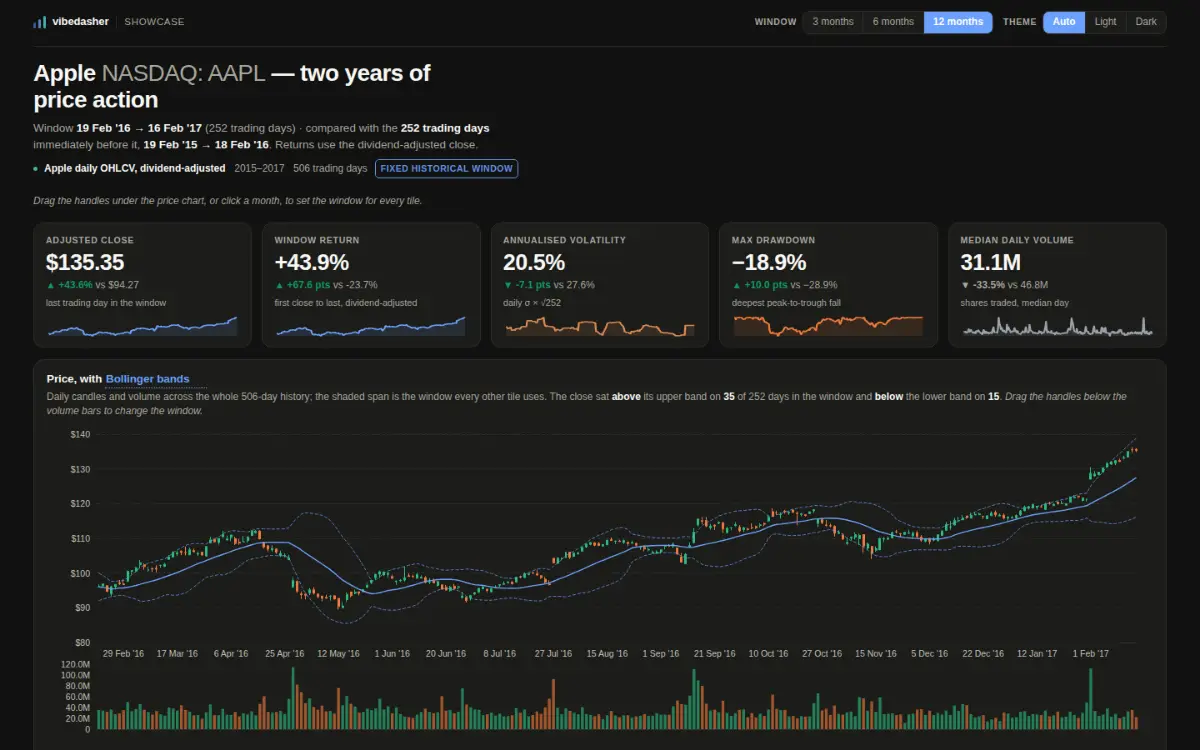
Ein Screenshot des veröffentlichten Dashboards, aufgenommen von derselben Adresse, die jede Person öffnen kann.
- Datenweg
- Abfrageweg
- Pro Aufruf
- 33 KB geladen, 1 Extrakt
- Datenalter
- Stand 2017-02-16
- Erreichbarkeit
- öffnet ohne Konto
Am laufenden Host gemessen, ohne jede Zugangsdaten, am 2026-10-08.
Die Frage, die es beantwortet
Trend, drawdown, the shape of the return distribution, the calendar, and whether volatility was clustering.
Die Daten, und über welchen Zeitraum
A closed window, loaded once. A demonstration dataset, not a market feed.
Wie es seine Zeilen bekommt
One query, in your browser, with no key.
Was zurückkommt
506 rows × 11 columns. Every statistic is derived from them in your browser.
Was schwierig war
Max drawdown is not the low minus the high. It needs a running peak, so a 19% fall from February’s top still counts even though the price later went past it.
Was nach dem Bauen passierte
Frozen. A closed two-year window.
Das Dashboard selbst
Dashboard live öffnenDas Dashboard lädt vom Viewer-Host. Vorher wird nichts von dort geholt, diese Seite berührt diese Herkunft also nur, wenn du es willst.
https://share.vibedasher.com/eu/vibedasher/aapl-two-years-of-price-action?exec=wasm
Was hier lädt, ist das veröffentlichte Dashboard, von derselben Adresse, die jede andere Person öffnen würde — keine von Hand nachgezogene Kopie. Das Standbild darüber ist ein Screenshot genau dieser Adresse.
Veröffentlicht von Vibedasher