The Earth is not getting noisier. We got better at listening.
USGS / ANSS ComCat · public domain · 1960–2025 (+2026 in progress) · 402 annual counts · 7,694 recent events
Two datasets behind one dashboard, both on a schedule: the long count series daily, the event window every three hours. It reads as of 2026-01-01 because the long series advances once a year; the event tile inside it is hours old.
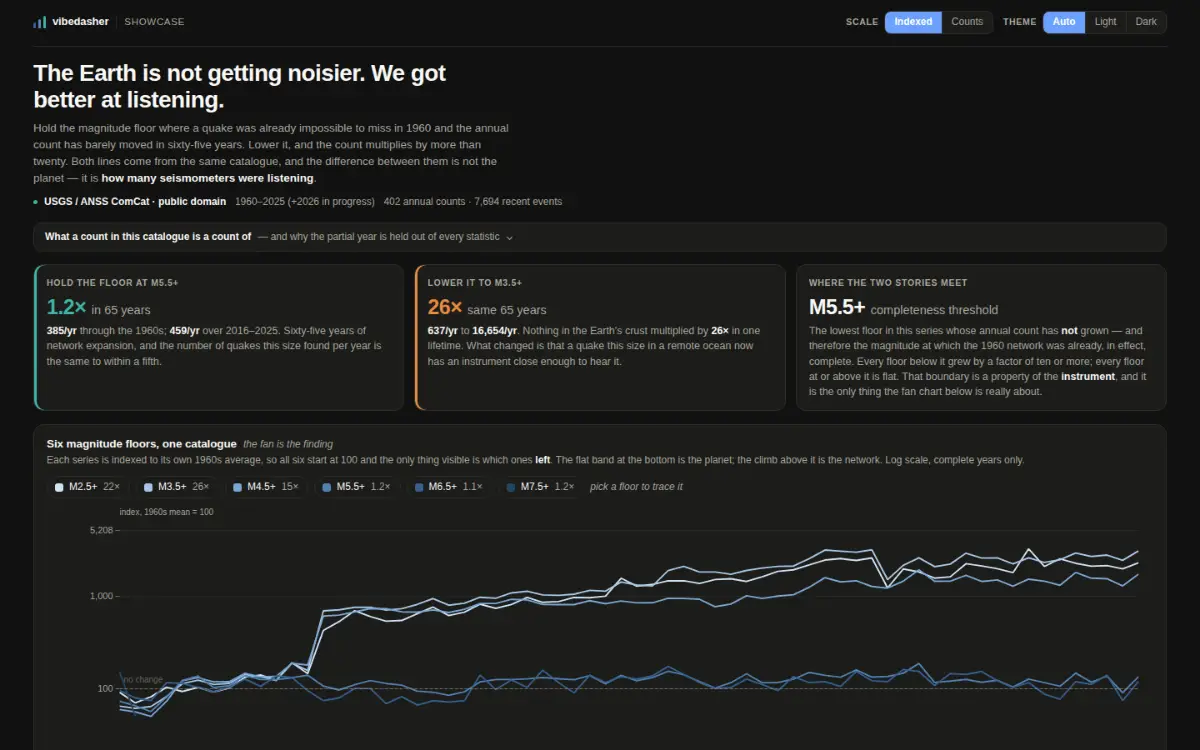
Ein Screenshot des veröffentlichten Dashboards, aufgenommen von derselben Adresse, die jede Person öffnen kann.
- Datenweg
- Abfrageweg
- Pro Aufruf
- 307.1 KB geladen, 2 Extrakt
- Datenalter
- Stand 2026-01-01
- Erreichbarkeit
- öffnet ohne Konto
Am laufenden Host gemessen, ohne jede Zugangsdaten, am 2026-10-08.
Die Frage, die es beantwortet
The number of recorded earthquakes has risen for sixty-five years. Is that the planet, or is it us?
Die Daten, und über welchen Zeitraum
USGS earthquake catalogue: annual counts at six magnitude floors since 1960, and every M4.5+ event in the last year.
Wie es seine Zeilen bekommt
Two queries, in your browser, with no key.
Was zurückkommt
402 annual counts in 3.8 KB; 7,694 recent events in 310 KB.
Was schwierig war
Below about M5.5 the early decades are incomplete, so comparing raw counts across sixty-five years measures the network rather than the Earth. Six floors are drawn so you can see where that begins.
Was nach dem Bauen passierte
Refreshed daily.
Das Dashboard selbst
Dashboard live öffnenDas Dashboard lädt vom Viewer-Host. Vorher wird nichts von dort geholt, diese Seite berührt diese Herkunft also nur, wenn du es willst.
https://share.vibedasher.com/eu/vibedasher/global-seismicity-1960-2026-the-instrument-not-the-planet?exec=wasm
Was hier lädt, ist das veröffentlichte Dashboard, von derselben Adresse, die jede andere Person öffnen würde — keine von Hand nachgezogene Kopie. Das Standbild darüber ist ein Screenshot genau dieser Adresse.
Veröffentlicht von Vibedasher