The ones we found afterwards
NASA/JPL close-approach data joined to the Small-Body Database · US Government work, not subject to copyright · 1900–2100 · 1,697 passes inside the Moon’s orbit
A cron reloads the source table from JPL at 05:40 UTC; the dataset refresh re-reads it at 06:25 and rebuilds the wasm extract. A newly discovered object brings its past approaches with it, so a reload can add a pass from 1911.
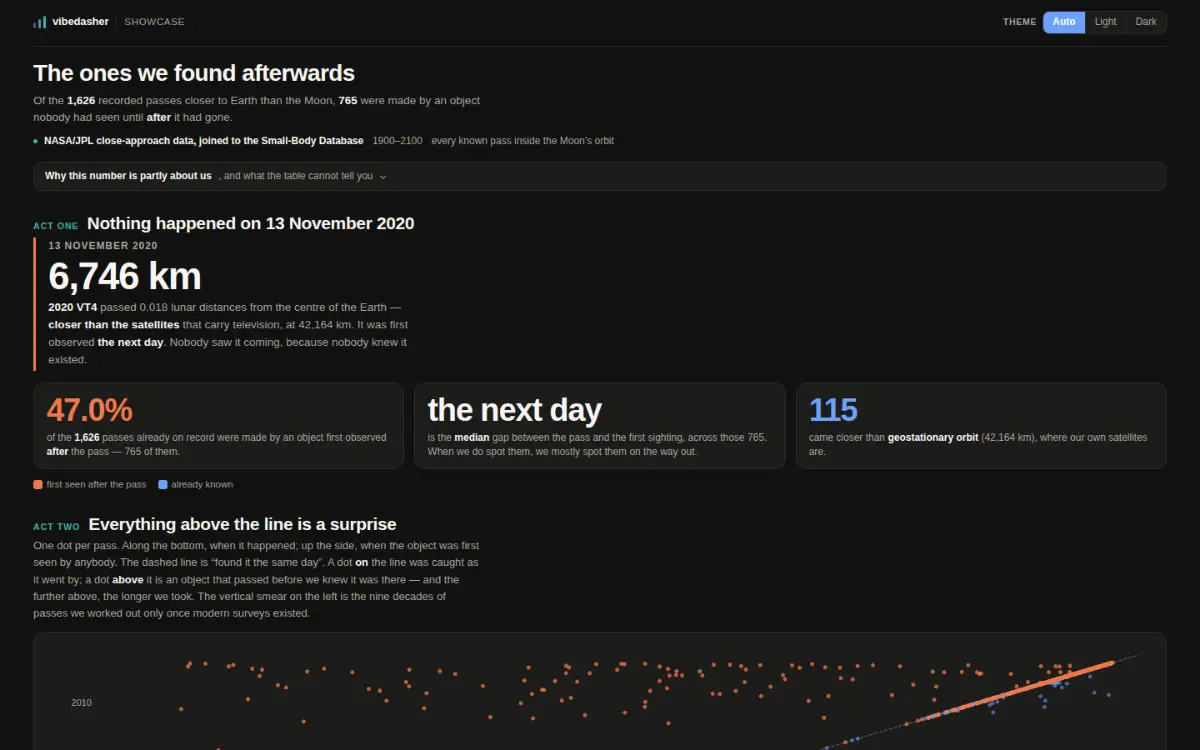
Ein Screenshot des veröffentlichten Dashboards, aufgenommen von derselben Adresse, die jede Person öffnen kann.
- Datenweg
- Abfrageweg
- Pro Aufruf
- 115.8 KB geladen, 1 Extrakt
- Datenalter
- Stand 2026-10-08
- Erreichbarkeit
- öffnet ohne Konto
Am laufenden Host gemessen, ohne jede Zugangsdaten, am 2026-10-09.
Die Frage, die es beantwortet
How often does something pass closer to us than the Moon — and did we see it coming?
Die Daten, und über welchen Zeitraum
JPL’s close-approach table for every pass inside one lunar distance, joined to the Small-Body Database for when each object was first seen.
Wie es seine Zeilen bekommt
One query, in your browser, with no key.
Was zurückkommt
1,697 rows × 14 columns — one S3 GET, no compute.
Was schwierig war
Distances are measured from the Earth’s centre, so the geostationary ring is 42,164 km and not the 35,786 km altitude. Using the altitude undercounts the passes inside the satellite ring by nineteen.
Was nach dem Bauen passierte
Refreshed daily.
Das Dashboard selbst
Dashboard live öffnenDas Dashboard lädt vom Viewer-Host. Vorher wird nichts von dort geholt, diese Seite berührt diese Herkunft also nur, wenn du es willst.
https://share.vibedasher.com/eu/vibedasher/the-ones-we-found-afterwards?exec=wasm
Was hier lädt, ist das veröffentlichte Dashboard, von derselben Adresse, die jede andere Person öffnen würde — keine von Hand nachgezogene Kopie. Das Standbild darüber ist ein Screenshot genau dieser Adresse.
Veröffentlicht von Vibedasher