Two centuries of carbon — what the world burned, and who burned it
CDIAC · 1751–2010 · 260 annual observations
Two and a half centuries of fossil-fuel carbon in 5.8 KB, published public, one query over the credential-free lane.
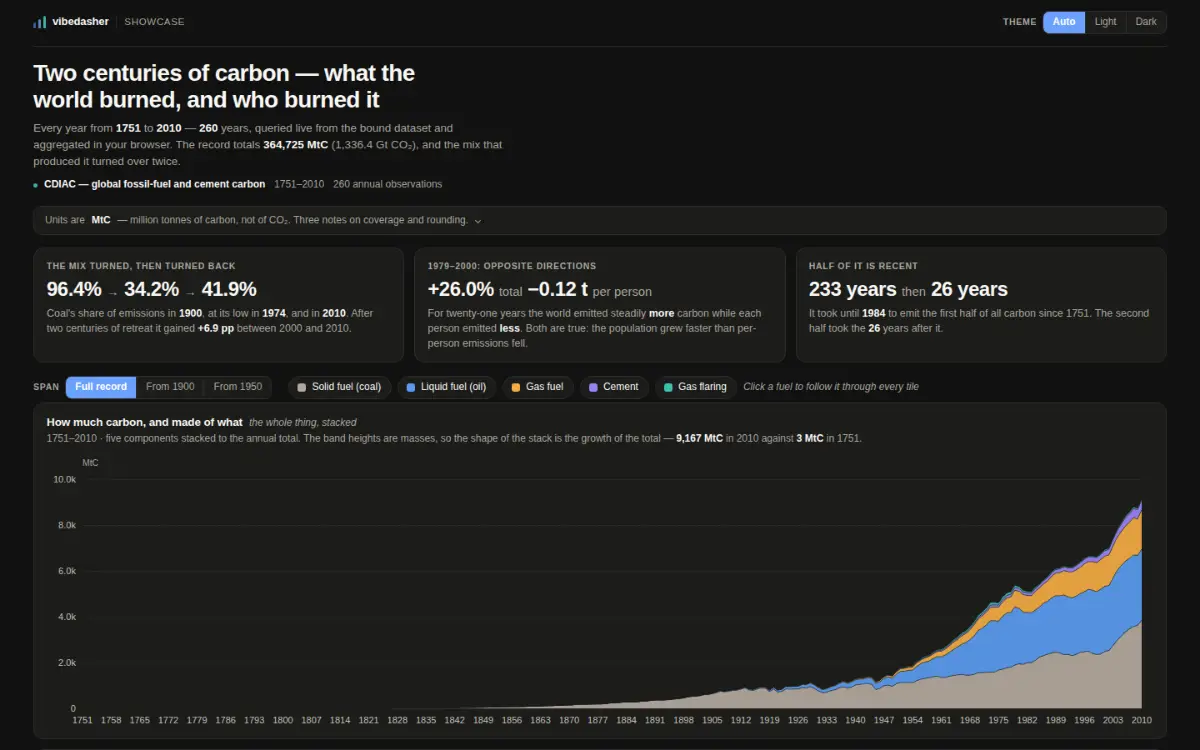
Ein Screenshot des veröffentlichten Dashboards, aufgenommen von derselben Adresse, die jede Person öffnen kann.
- Datenweg
- Abfrageweg
- Pro Aufruf
- 5.7 KB geladen, 1 Extrakt
- Datenalter
- das Produkt nennt keines — dieser Datensatz hat keine Datumsspalte
- Erreichbarkeit
- öffnet ohne Konto
Am laufenden Host gemessen, ohne jede Zugangsdaten, am 2026-10-08.
Die Frage, die es beantwortet
When did the absolute total and the per-person figure stop telling the same story?
Die Daten, und über welchen Zeitraum
Total fossil-fuel carbon, plus solid, liquid and gas fuel, cement, gas flaring and per capita.
Wie es seine Zeilen bekommt
One query, live, in your browser. The rows arrive when you open the page.
Was zurückkommt
260 rows × 8 columns, and every tile comes from it.
Was schwierig war
per_capita is absent before 1950. Coerced to zero it draws a line along the floor for two centuries, so the chart leaves a gap instead.
Was nach dem Bauen passierte
Frozen. The record ends in 2010.
Das Dashboard selbst
Dashboard live öffnenDas Dashboard lädt vom Viewer-Host. Vorher wird nichts von dort geholt, diese Seite berührt diese Herkunft also nur, wenn du es willst.
https://share.vibedasher.com/eu/vibedasher/two-centuries-of-carbon?exec=wasm
Was hier lädt, ist das veröffentlichte Dashboard, von derselben Adresse, die jede andere Person öffnen würde — keine von Hand nachgezogene Kopie. Das Standbild darüber ist ein Screenshot genau dieser Adresse.
Veröffentlicht von Vibedasher