Growth peaked in 1963, and 37 countries are shrinking
World Bank SP.POP.TOTL · 1960–2024 · 17,195 country-year observations
Sixty-five years of population for every country: a choropleth encoding a rate, circles encoding a count. One query, a 102 KB extract, every tile re-derived when the year scrubber moves.
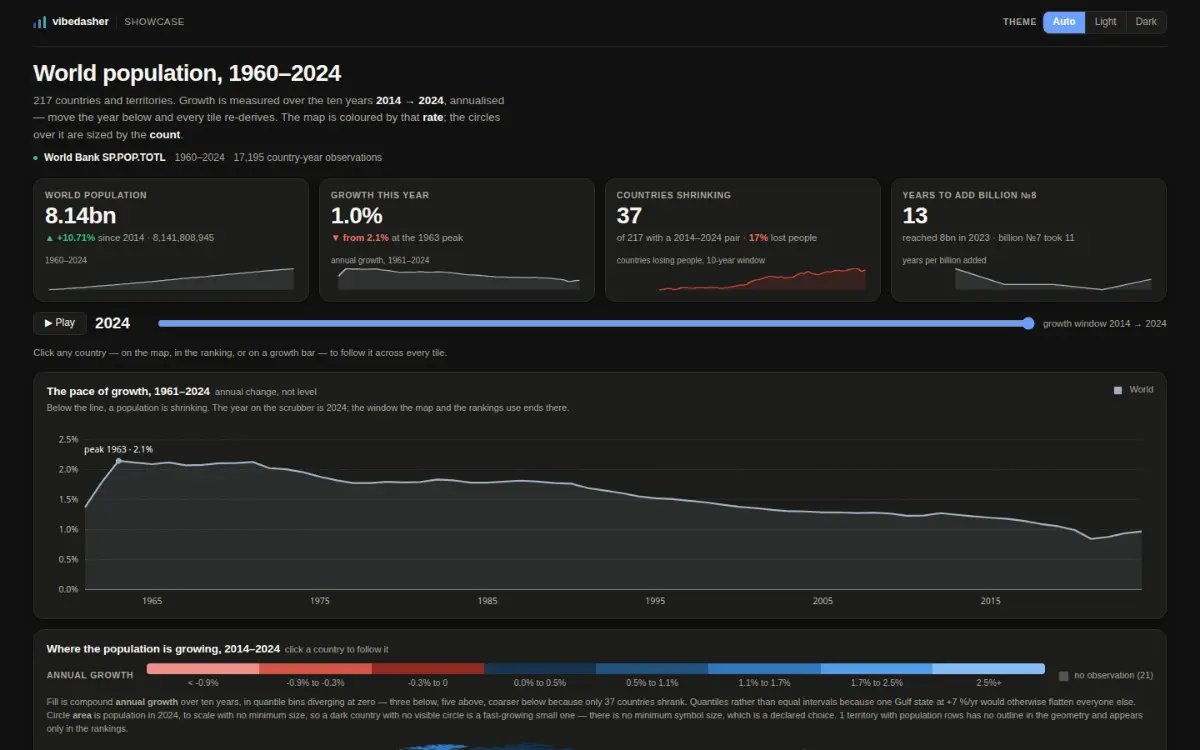
Ein Screenshot des veröffentlichten Dashboards, aufgenommen von derselben Adresse, die jede Person öffnen kann.
- Datenweg
- Abfrageweg
- Pro Aufruf
- 99.3 KB geladen, 1 Extrakt
- Datenalter
- das Produkt nennt keines — dieser Datensatz hat keine Datumsspalte
- Erreichbarkeit
- öffnet ohne Konto
Am laufenden Host gemessen, ohne jede Zugangsdaten, am 2026-10-08.
Die Frage, die es beantwortet
Who is growing, who is shrinking — and does the rate or the count tell you?
Die Daten, und über welchen Zeitraum
Country code, country name, year, value. Nothing else.
Wie es seine Zeilen bekommt
One query. Moving the year scrubber re-derives every tile in your browser, with no round trip.
Was zurückkommt
17,195 rows × 4 columns, in one S3 GET.
Was schwierig war
The fill is annual growth, a rate; the circles are population, a count. One encoding hides the finding, so the two are allowed to disagree.
Was nach dem Bauen passierte
Frozen. The World Bank publishes once a year.
Das Dashboard selbst
Dashboard live öffnenDas Dashboard lädt vom Viewer-Host. Vorher wird nichts von dort geholt, diese Seite berührt diese Herkunft also nur, wenn du es willst.
https://share.vibedasher.com/eu/vibedasher/world-population-1960-2024?exec=wasm
Was hier lädt, ist das veröffentlichte Dashboard, von derselben Adresse, die jede andere Person öffnen würde — keine von Hand nachgezogene Kopie. Das Standbild darüber ist ein Screenshot genau dieser Adresse.
Veröffentlicht von Vibedasher