The Earth is not getting noisier. We got better at listening.
USGS / ANSS ComCat · public domain · 1960–2025 (+2026 in progress) · 402 annual counts · 7,694 recent events
Two datasets behind one dashboard, both on a schedule: the long count series daily, the event window every three hours. It reads as of 2026-01-01 because the long series advances once a year; the event tile inside it is hours old.
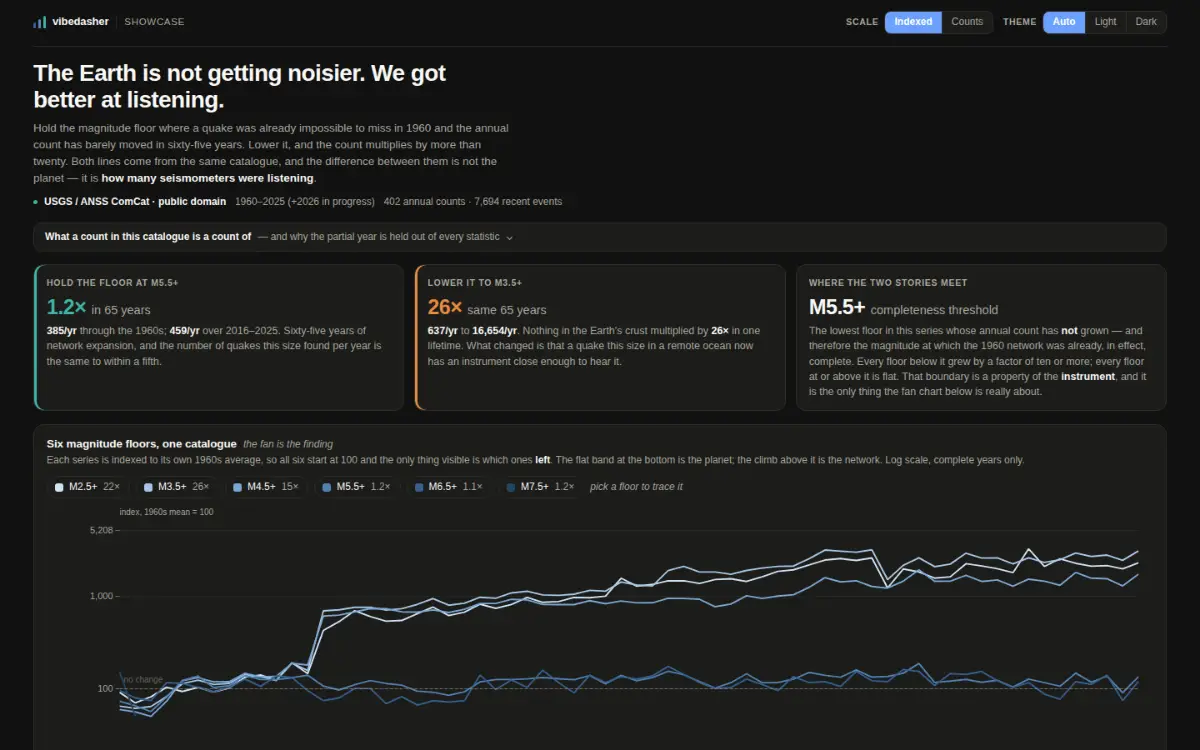
Une capture d'écran du tableau de bord publié, prise à l'adresse que n'importe qui peut ouvrir.
- Voie de données
- Voie de requête
- Par vue
- 307.1 Ko téléchargés, 2 extrait
- Âge des données
- au 2026-01-01
- Accessibilité
- s'ouvre sans compte
Mesuré sur l'hôte en direct, sans aucune identification, le 2026-10-08.
La question à laquelle il répond
The number of recorded earthquakes has risen for sixty-five years. Is that the planet, or is it us?
Les données, et sur quelle période
USGS earthquake catalogue: annual counts at six magnitude floors since 1960, and every M4.5+ event in the last year.
Comment il obtient ses lignes
Two queries, in your browser, with no key.
Ce qui revient
402 annual counts in 3.8 KB; 7,694 recent events in 310 KB.
Ce qui a été difficile
Below about M5.5 the early decades are incomplete, so comparing raw counts across sixty-five years measures the network rather than the Earth. Six floors are drawn so you can see where that begins.
Ce qui s'est passé après la construction
Refreshed daily.
Le tableau de bord lui-même
Ouvrir le tableau de bordLe tableau de bord se charge depuis l'hôte de visualisation. Rien n'en est téléchargé avant votre demande, donc cette page ne touche pas cette origine sans votre accord.
https://share.vibedasher.com/eu/vibedasher/global-seismicity-1960-2026-the-instrument-not-the-planet?exec=wasm
Ce qui se charge ici est le tableau de bord publié, depuis l'adresse que n'importe qui d'autre ouvrirait — pas une copie maintenue à la main. L'image fixe au-dessus est une capture d'écran de cette même adresse.
Publié par Vibedasher