The ones we found afterwards
NASA/JPL close-approach data joined to the Small-Body Database · US Government work, not subject to copyright · 1900–2100 · 1,697 passes inside the Moon’s orbit
A cron reloads the source table from JPL at 05:40 UTC; the dataset refresh re-reads it at 06:25 and rebuilds the wasm extract. A newly discovered object brings its past approaches with it, so a reload can add a pass from 1911.
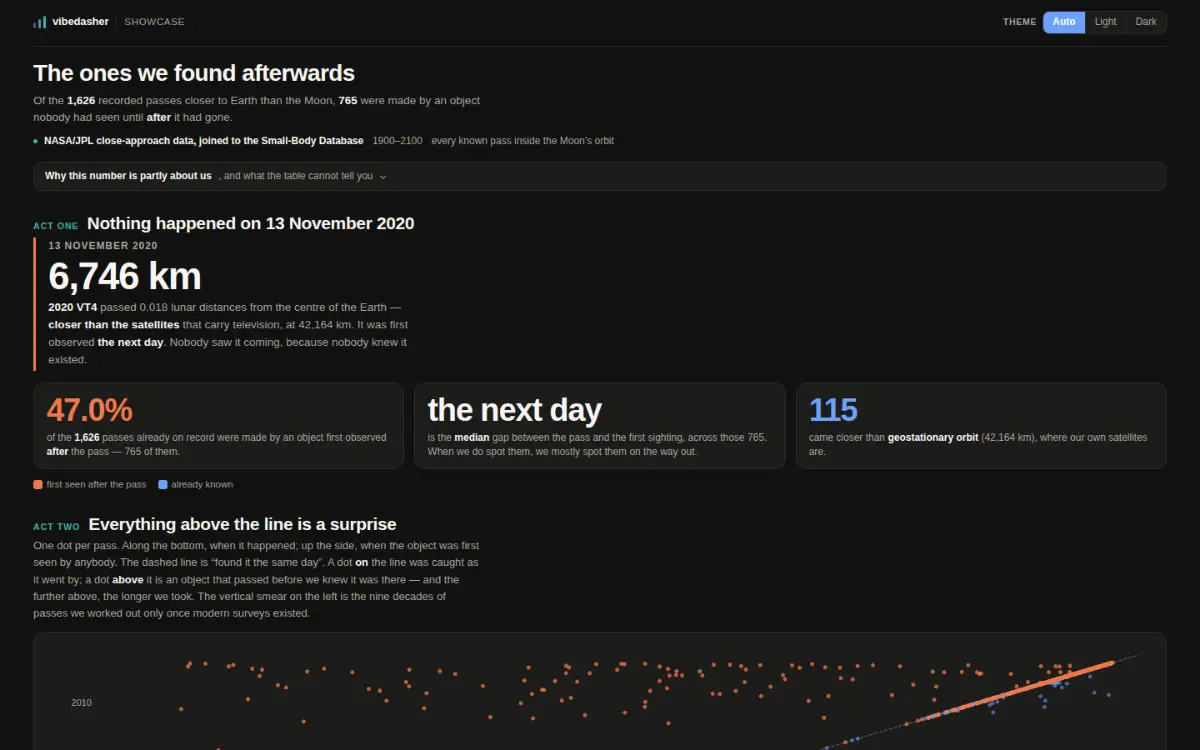
Une capture d'écran du tableau de bord publié, prise à l'adresse que n'importe qui peut ouvrir.
- Voie de données
- Voie de requête
- Par vue
- 115.8 Ko téléchargés, 1 extrait
- Âge des données
- au 2026-10-08
- Accessibilité
- s'ouvre sans compte
Mesuré sur l'hôte en direct, sans aucune identification, le 2026-10-09.
La question à laquelle il répond
How often does something pass closer to us than the Moon — and did we see it coming?
Les données, et sur quelle période
JPL’s close-approach table for every pass inside one lunar distance, joined to the Small-Body Database for when each object was first seen.
Comment il obtient ses lignes
One query, in your browser, with no key.
Ce qui revient
1,697 rows × 14 columns — one S3 GET, no compute.
Ce qui a été difficile
Distances are measured from the Earth’s centre, so the geostationary ring is 42,164 km and not the 35,786 km altitude. Using the altitude undercounts the passes inside the satellite ring by nineteen.
Ce qui s'est passé après la construction
Refreshed daily.
Le tableau de bord lui-même
Ouvrir le tableau de bordLe tableau de bord se charge depuis l'hôte de visualisation. Rien n'en est téléchargé avant votre demande, donc cette page ne touche pas cette origine sans votre accord.
https://share.vibedasher.com/eu/vibedasher/the-ones-we-found-afterwards?exec=wasm
Ce qui se charge ici est le tableau de bord publié, depuis l'adresse que n'importe qui d'autre ouvrirait — pas une copie maintenue à la main. L'image fixe au-dessus est une capture d'écran de cette même adresse.
Publié par Vibedasher