What it does
Your agent builds the dashboard. We keep it alive.
Hosting, refresh, alerts, delivery and access control for dashboards your agent writes.
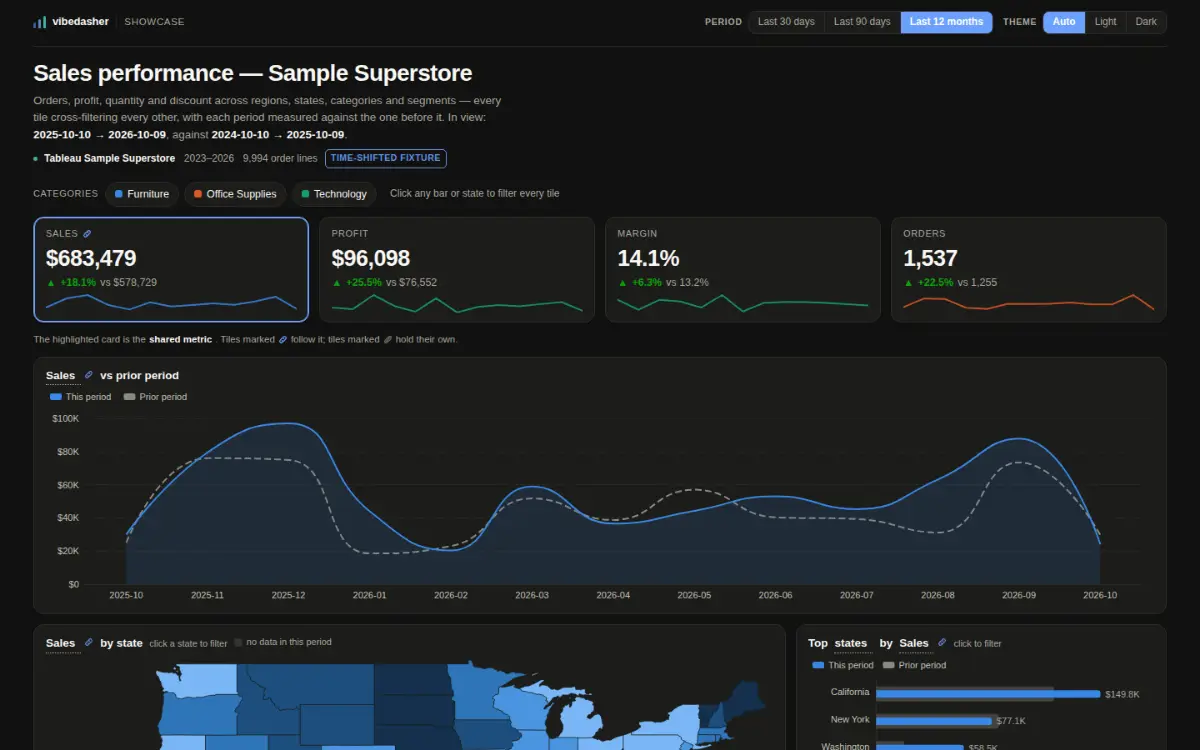
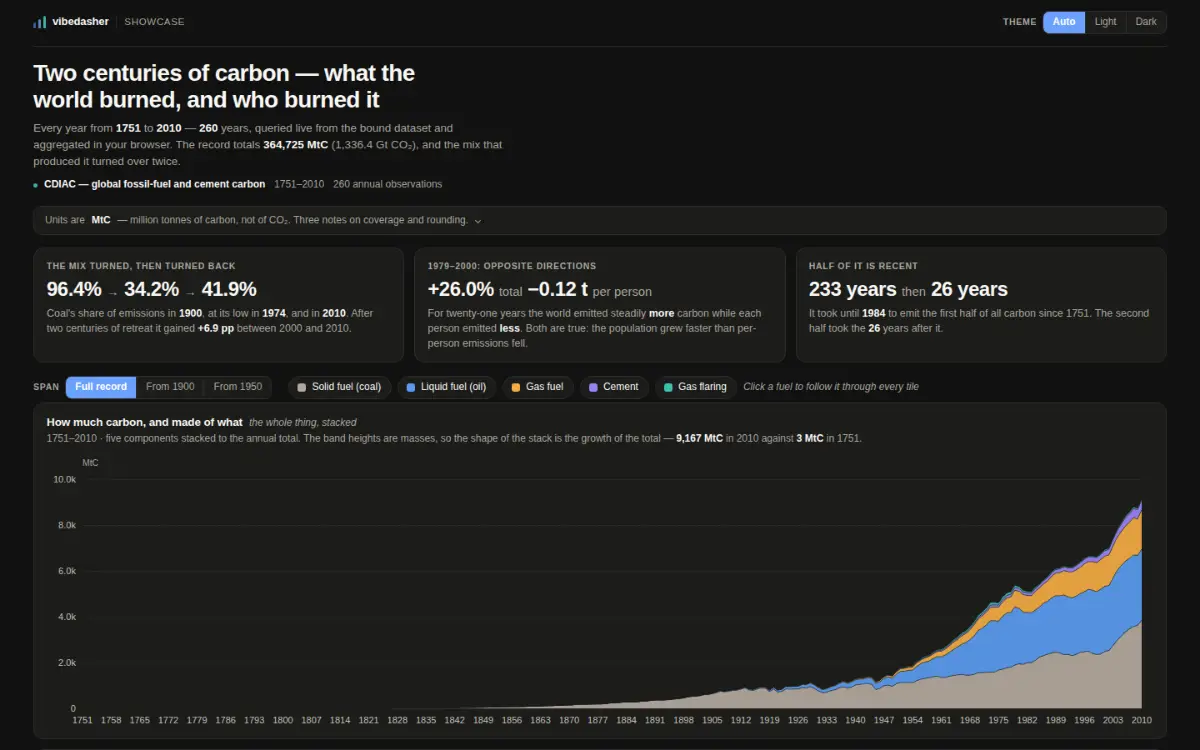
MCP server and SDKs
Python and TypeScript. Your agent uploads data, builds the dashboard, publishes it and sets the alert, from the terminal.
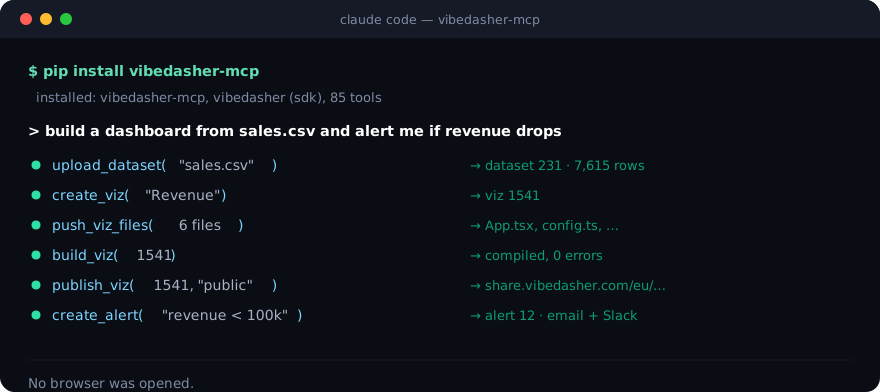
A real session, unedited.
Public dashboards
Publish to a URL. Anyone opens it with no account and no warehouse credentials.
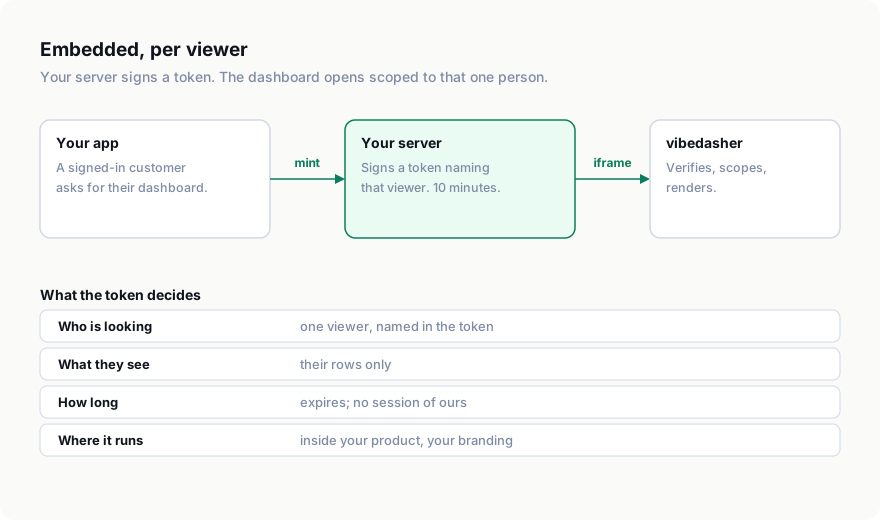
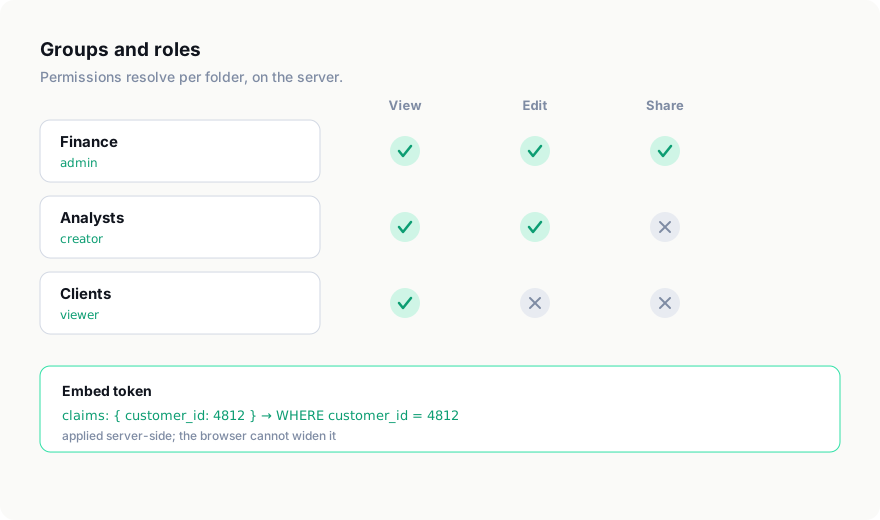
Embedded, with a signed token
Your server signs a short-lived token naming one viewer. The iframe carries it, the dashboard opens scoped to that person, and nobody signs in to us. This is the half that takes a team two quarters.
Eject to code
Eject the dashboard as React source into your own repository. It keeps reading data through our API, until you decide it shouldn't.
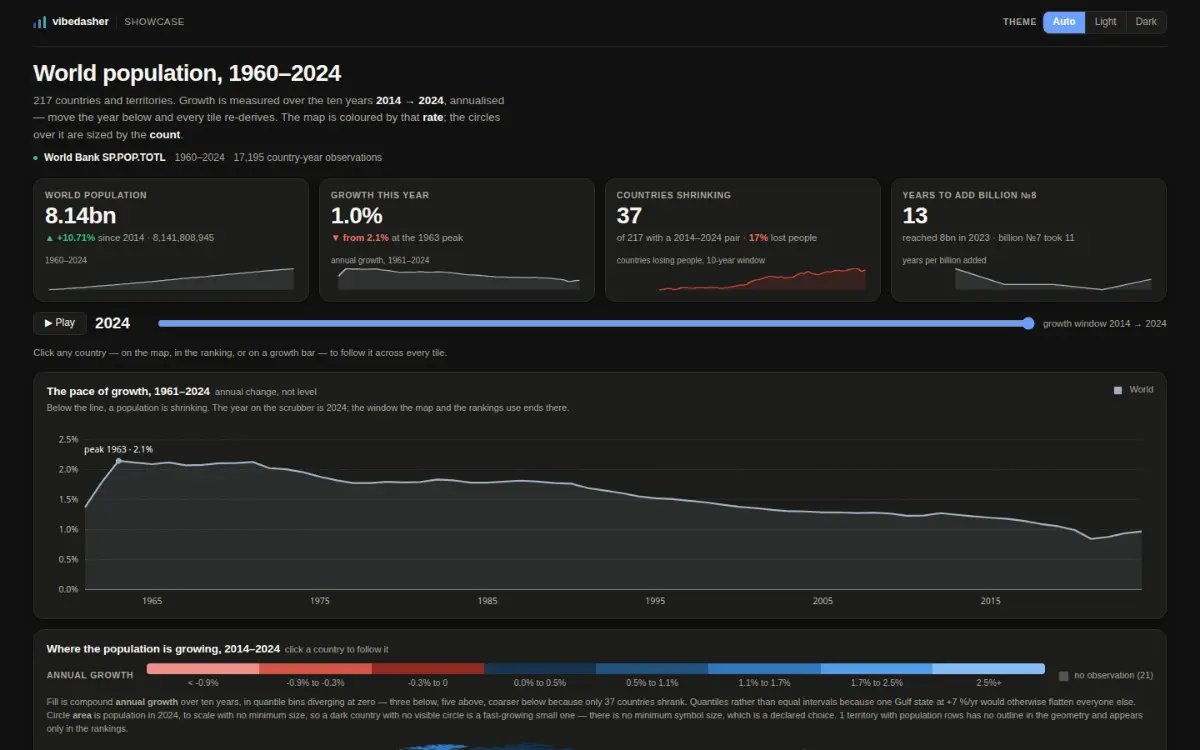
See an ejected dashboard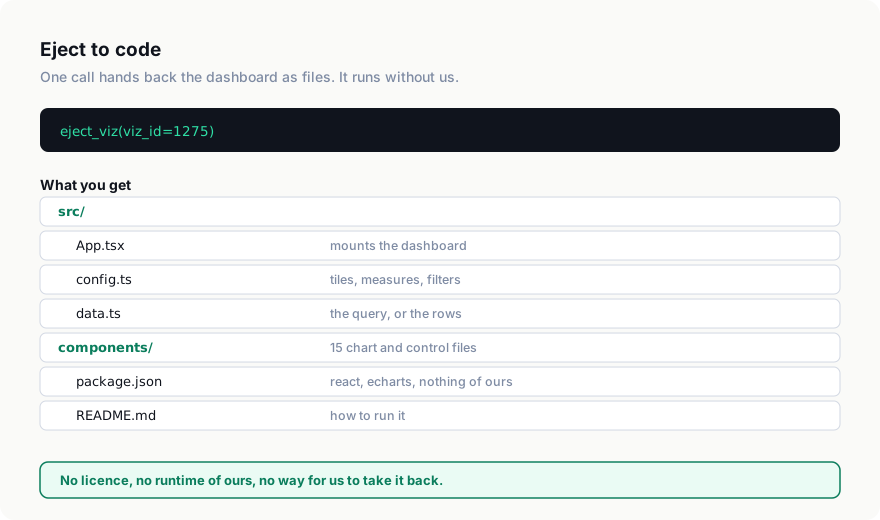
Scheduled refresh
File uploads, warehouse connections and SQL datasets, refreshed on the schedule you set.
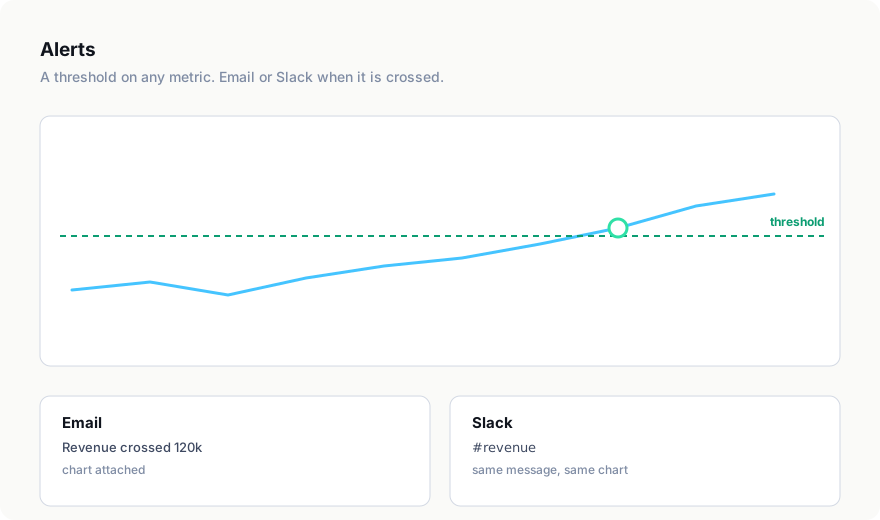
Alerts
A threshold on any metric. Email or Slack when it is crossed, with the chart attached.
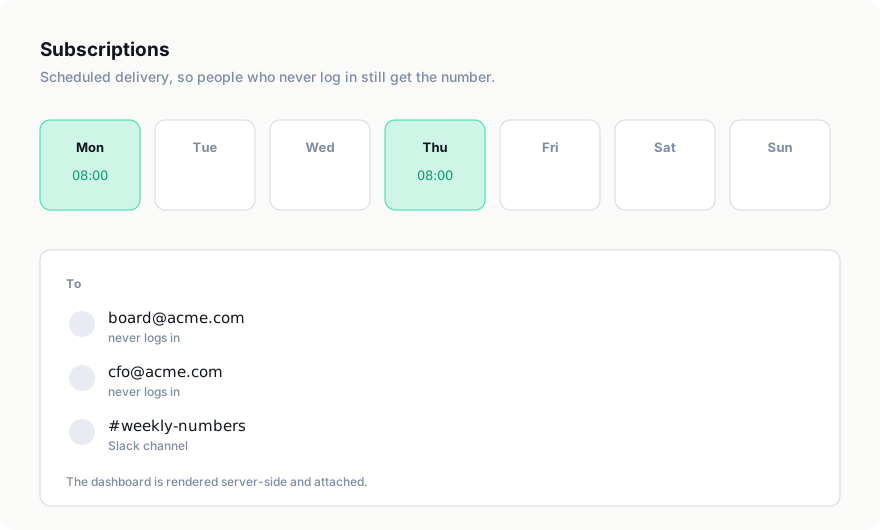
Subscriptions
Scheduled email delivery of a dashboard, so people who never log in still get the number.
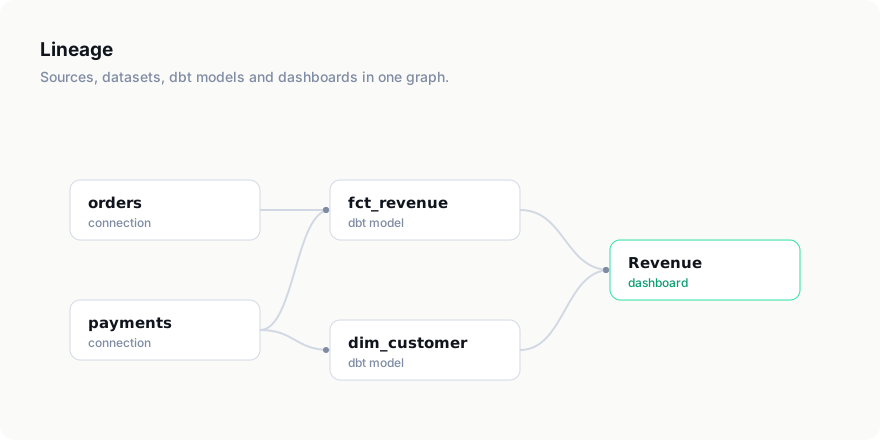
Lineage
Datasets, dashboards and dbt models in one graph. See what breaks before you change a source.
RBAC
Users, groups, roles and folder permissions. For customers, a signed embed token carries per-viewer row filters the browser cannot widen.
Row-level access
Coming soon
One dashboard, and each viewer sees only their own rows — filtered on the server, from the same signed token that lets them in.
Connectors
19 connectors, from a CSV on your laptop to Snowflake, BigQuery, Postgres and S3.


Everything else
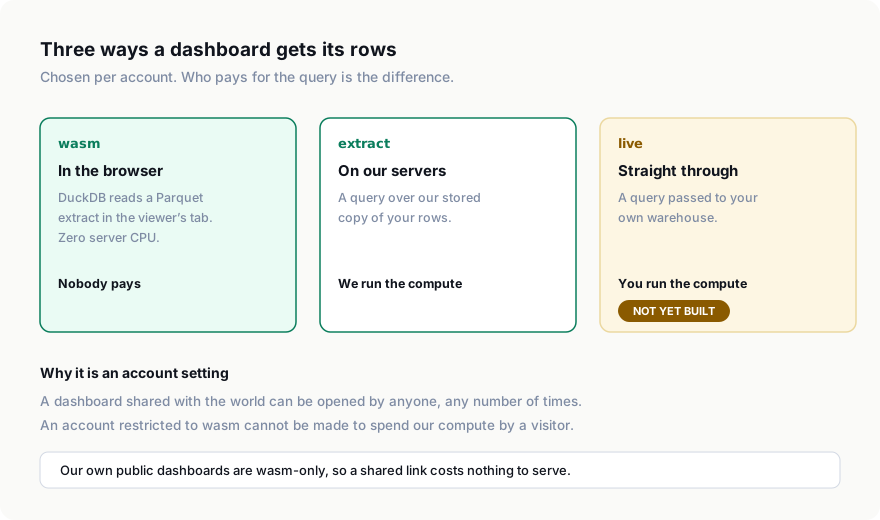
Query lanes
wasm in the viewer's browser, or SQL on the server. Per dashboard.
dbt projects
Import models, runs and tests. They appear in lineage.
Folders
Organise dashboards and datasets, with permissions per folder.
API keys
Server-to-server access, scoped to one account.
Versioning
Every draft is a commit. Browse the history and revert a file.
Screenshots
Server-side capture of any dashboard, for a report or a channel.
Iceberg storage
Your data lands in open Parquet you can read without us.
Self-hosted
The same engine in your own network.
Six languages
The app and the docs in EN, FR, ES, DE, IT and PT-BR.
Cloud, or your own network
Vibedasher Cloud
Dashboards and data in Frankfurt. Sign-in identity is held in the United States, for every account. Pay for what you query.
Self-hosted
The same engine inside your network, so your rows never leave it. An engagement scoped with us, not a download.
How self-hosting worksStart with a dashboard you can open
Every dashboard in the showcase is live, public, and was built by an agent.
Open the showcase