Apple, up 44% with a 19% hole in the middle
Apple daily OHLCV, dividend-adjusted · 2015–2017 · 506 trading days
Two years of Apple price data, published public. One query fetches a 33 KB Parquet extract; the window is closed, so the data stays as of 2017-02-16.
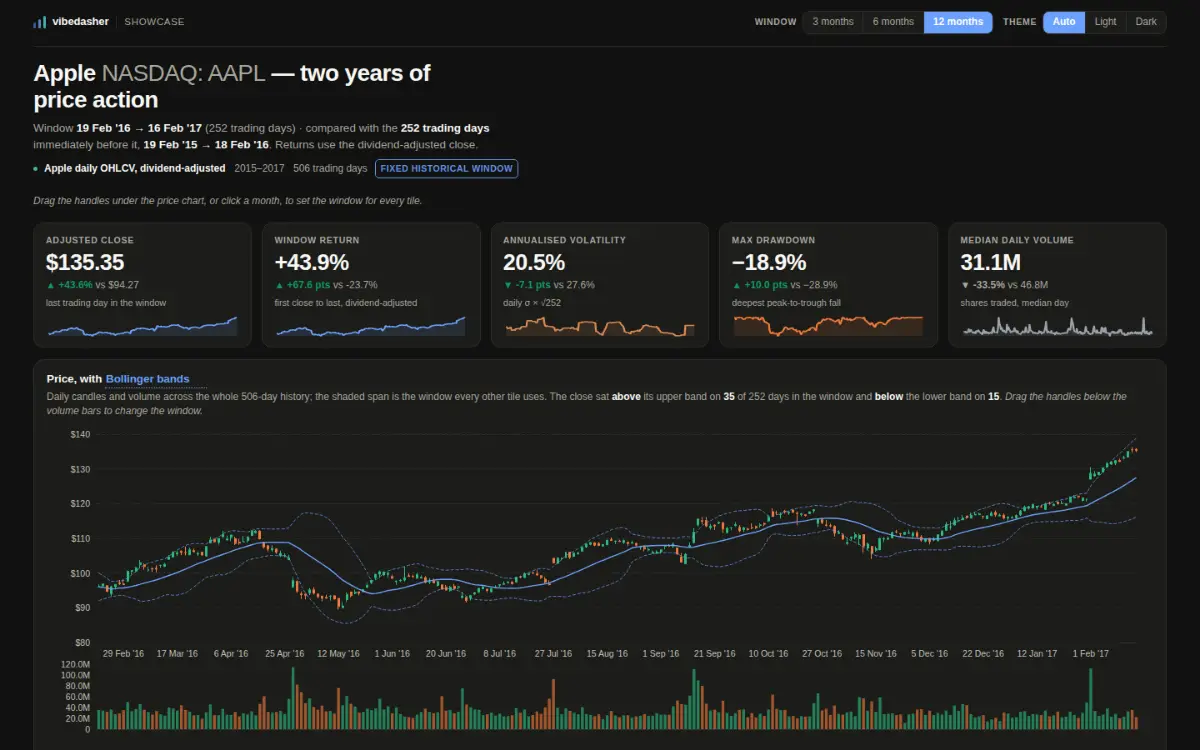
Una schermata della dashboard pubblicata, catturata dallo stesso indirizzo che chiunque può aprire.
- Via dati
- Via di interrogazione
- Per visita
- 33 KB scaricati, 1 estratto
- Età dei dati
- al 2017-02-16
- Raggiungibilità
- si apre senza account
Misurato sull'host in funzione, senza alcuna credenziale, il 2026-10-08.
La domanda a cui risponde
Trend, drawdown, the shape of the return distribution, the calendar, and whether volatility was clustering.
I dati, e su quale periodo
A closed window, loaded once. A demonstration dataset, not a market feed.
Come ottiene le righe
One query, in your browser, with no key.
Cosa torna
506 rows × 11 columns. Every statistic is derived from them in your browser.
Cosa è stato difficile
Max drawdown is not the low minus the high. It needs a running peak, so a 19% fall from February’s top still counts even though the price later went past it.
Cosa è successo dopo la costruzione
Frozen. A closed two-year window.
La dashboard stessa
Apri la dashboard liveLa dashboard si carica dall'host di visualizzazione. Nulla viene scaricato da lì finché non lo chiedi, quindi questa pagina non tocca quell'origine senza il tuo consenso.
https://share.vibedasher.com/eu/vibedasher/aapl-two-years-of-price-action?exec=wasm
Qui si carica la dashboard pubblicata, dallo stesso indirizzo che aprirebbe chiunque altro — non una copia tenuta aggiornata a mano. L'immagine fissa sopra è una schermata di quello stesso indirizzo.
Pubblicata da Vibedasher