The ones we found afterwards
NASA/JPL close-approach data joined to the Small-Body Database · US Government work, not subject to copyright · 1900–2100 · 1,697 passes inside the Moon’s orbit
A cron reloads the source table from JPL at 05:40 UTC; the dataset refresh re-reads it at 06:25 and rebuilds the wasm extract. A newly discovered object brings its past approaches with it, so a reload can add a pass from 1911.
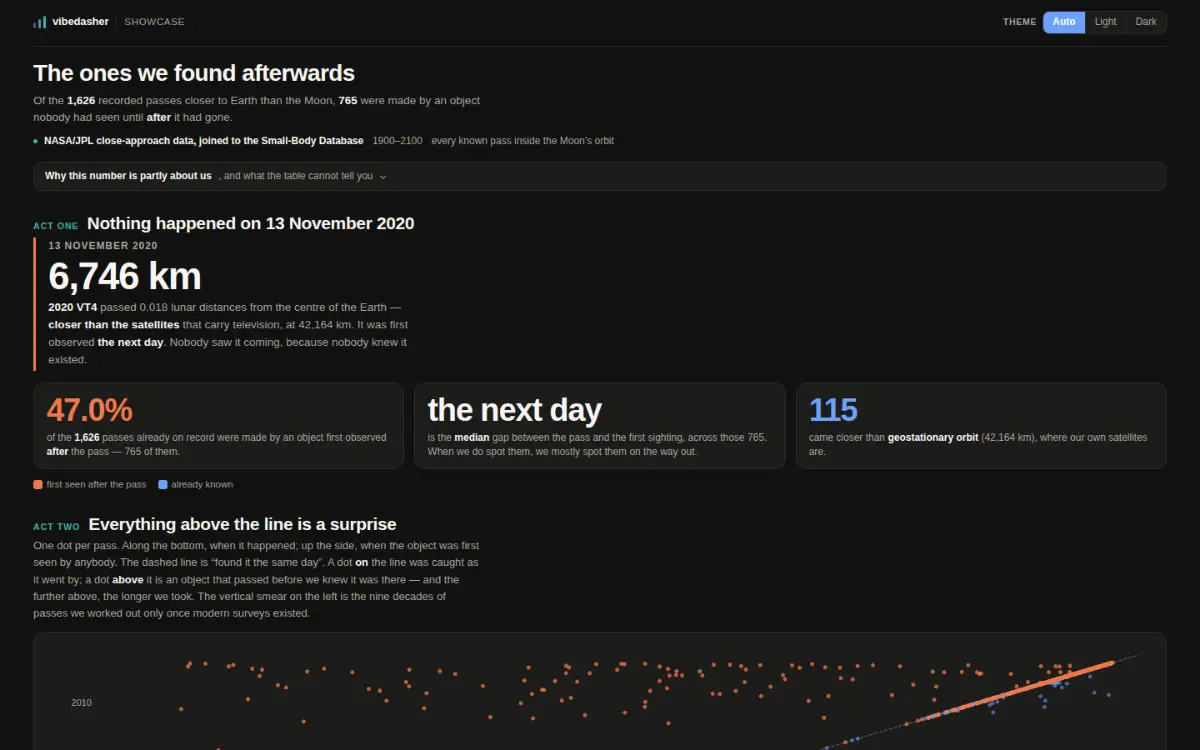
Una schermata della dashboard pubblicata, catturata dallo stesso indirizzo che chiunque può aprire.
- Via dati
- Via di interrogazione
- Per visita
- 115.8 KB scaricati, 1 estratto
- Età dei dati
- al 2026-10-08
- Raggiungibilità
- si apre senza account
Misurato sull'host in funzione, senza alcuna credenziale, il 2026-10-09.
La domanda a cui risponde
How often does something pass closer to us than the Moon — and did we see it coming?
I dati, e su quale periodo
JPL’s close-approach table for every pass inside one lunar distance, joined to the Small-Body Database for when each object was first seen.
Come ottiene le righe
One query, in your browser, with no key.
Cosa torna
1,697 rows × 14 columns — one S3 GET, no compute.
Cosa è stato difficile
Distances are measured from the Earth’s centre, so the geostationary ring is 42,164 km and not the 35,786 km altitude. Using the altitude undercounts the passes inside the satellite ring by nineteen.
Cosa è successo dopo la costruzione
Refreshed daily.
La dashboard stessa
Apri la dashboard liveLa dashboard si carica dall'host di visualizzazione. Nulla viene scaricato da lì finché non lo chiedi, quindi questa pagina non tocca quell'origine senza il tuo consenso.
https://share.vibedasher.com/eu/vibedasher/the-ones-we-found-afterwards?exec=wasm
Qui si carica la dashboard pubblicata, dallo stesso indirizzo che aprirebbe chiunque altro — non una copia tenuta aggiornata a mano. L'immagine fissa sopra è una schermata di quello stesso indirizzo.
Pubblicata da Vibedasher