Vitrine

Painéis

Cada cartão traz uma captura de tela do painel e, abaixo dela, o que aconteceu com esse painel depois de construído. Os fatos foram medidos contra o host em funcionamento sem nenhuma credencial, e uma verificação no momento da publicação recusa um cartão cujas afirmações deixam de ser verdadeiras.

Abaixo aparecem duas vias. Uma baixa uma extração Parquet no navegador do visitante; a outra leva suas linhas compiladas no pacote. A diferença está escrita em cada cartão, não é suavizada.

Filtrar

9 de 9

Tema

O que faz

Como ele obtém suas linhas

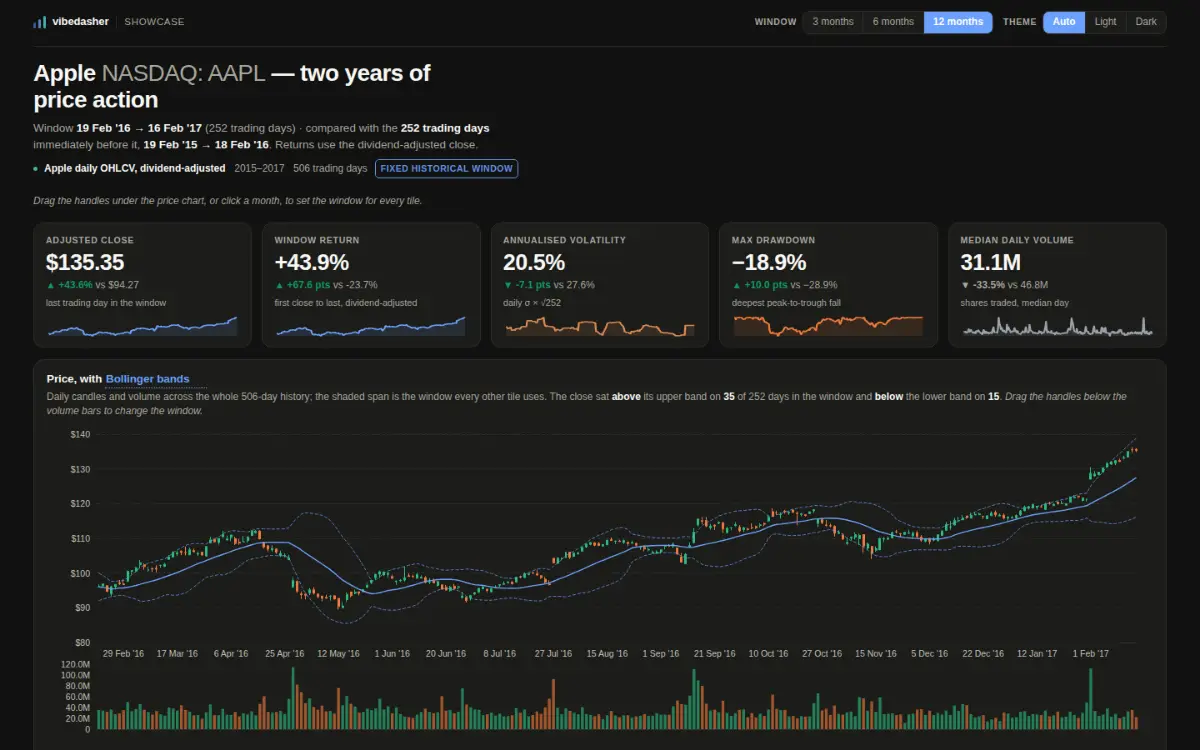
A dark dashboard titled "Apple NASDAQ: AAPL — two years of price action". A row of five statistic cards, each with a sparkline: adjusted close $135.35 (+43.6% on the prior window), window return +43.9%, annualised volatility 20.5%, max drawdown −18.9%, median daily volume 31.1M. Below them a candlestick price chart from February 2016 to February 2017 with a blue moving average and dotted Bollinger bands, and a green-and-red daily volume histogram underneath it.
Via de consulta

Apple, up 44% with a 19% hole in the middle

Two years of Apple price data, published public. One query fetches a 33 KB Parquet extract; the window is closed, so the data stays as of 2017-02-16.

  • Finanças
Dados
Apple daily OHLCV, dividend-adjusted · 2015–2017 · 506 trading days
Idade dos dados
em 2017-02-16
Por acesso
33 KB baixados, 1 extração
Publicado por
Vibedasher
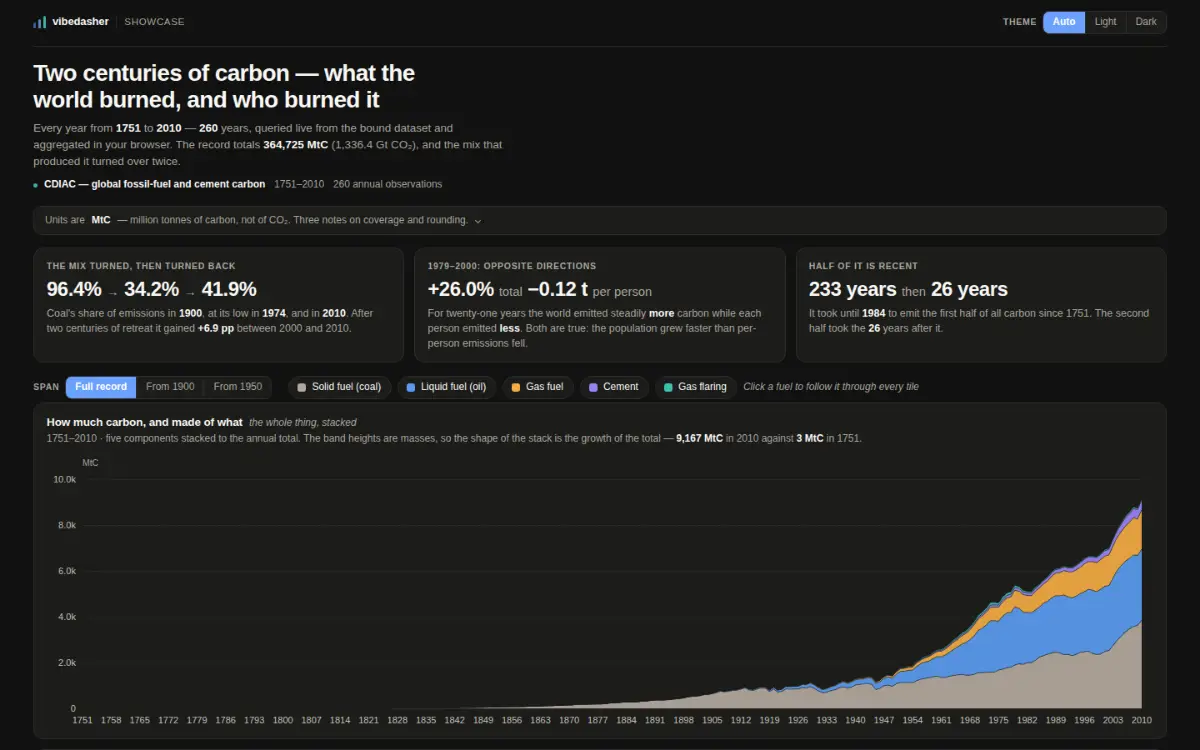
A dark dashboard titled "Two centuries of carbon — what the world burned, and who burned it". Three statistic cards read "the mix turned, then turned back" (coal 96.4% to 34.2% to 41.9%), "1979–2000: opposite directions" (+26.0% total against −0.12 t per person) and "half of it is recent" (233 years, then 26). A row of fuel filter chips sits above a stacked area chart of annual emissions in MtC from 1751 to 2010, rising from near zero to roughly 9,000.
Via de consulta

Two centuries of carbon — what the world burned, and who burned it

Two and a half centuries of fossil-fuel carbon in 5.8 KB, published public, one query over the credential-free lane.

  • Clima
  • Filtragem cruzada
Dados
CDIAC · 1751–2010 · 260 annual observations
Idade dos dados
o produto não declara nenhuma — este conjunto de dados não tem coluna de data
Por acesso
5.7 KB baixados, 1 extração
Publicado por
Vibedasher
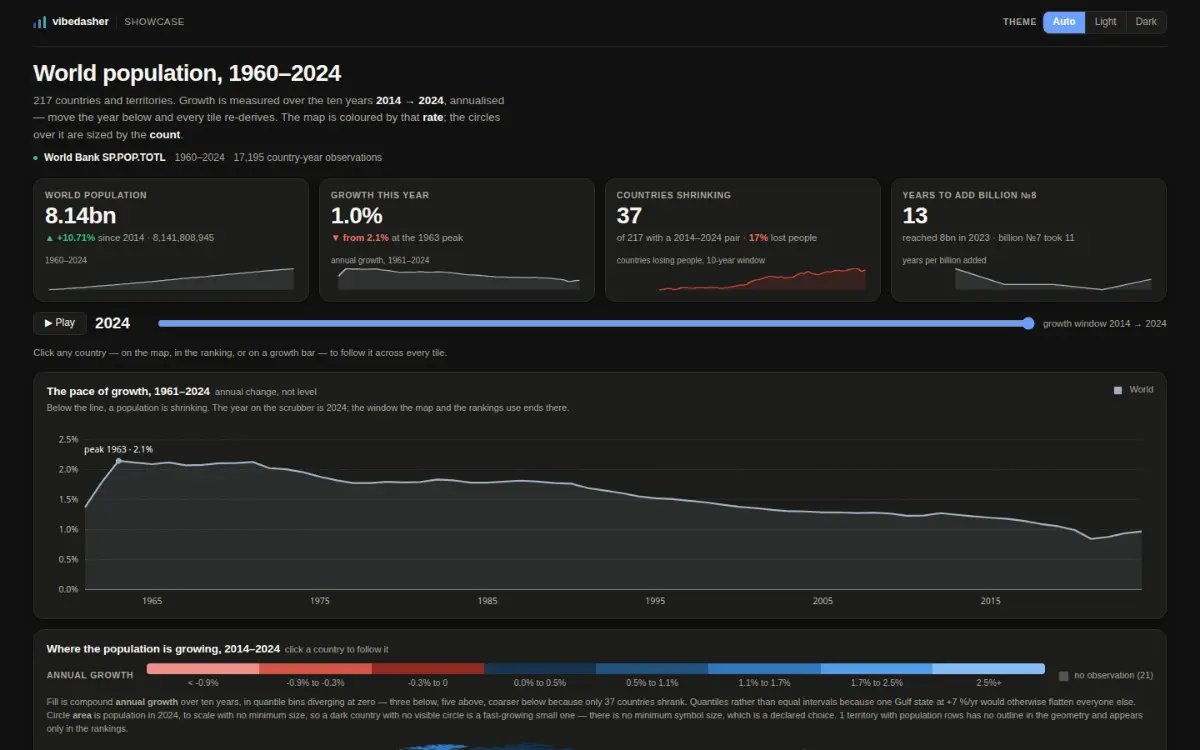
A dark dashboard titled "World population, 1960–2024". Four statistic cards: world population 8.14bn, growth this year 1.0% (down from the 2.1% peak in 1963), 37 of 217 countries shrinking, and 13 years to add the eighth billion. A year scrubber set to 2024 sits under them, then a line chart of annual growth falling from the 1963 peak to about 1%, and the start of a quantile-binned choropleth with a red-to-blue growth legend.
Via de consulta

Growth peaked in 1963, and 37 countries are shrinking

Sixty-five years of population for every country: a choropleth encoding a rate, circles encoding a count. One query, a 102 KB extract, every tile re-derived when the year scrubber moves.

  • População
  • Mapas
Dados
World Bank SP.POP.TOTL · 1960–2024 · 17,195 country-year observations
Idade dos dados
o produto não declara nenhuma — este conjunto de dados não tem coluna de data
Por acesso
99.3 KB baixados, 1 extração
Publicado por
Vibedasher
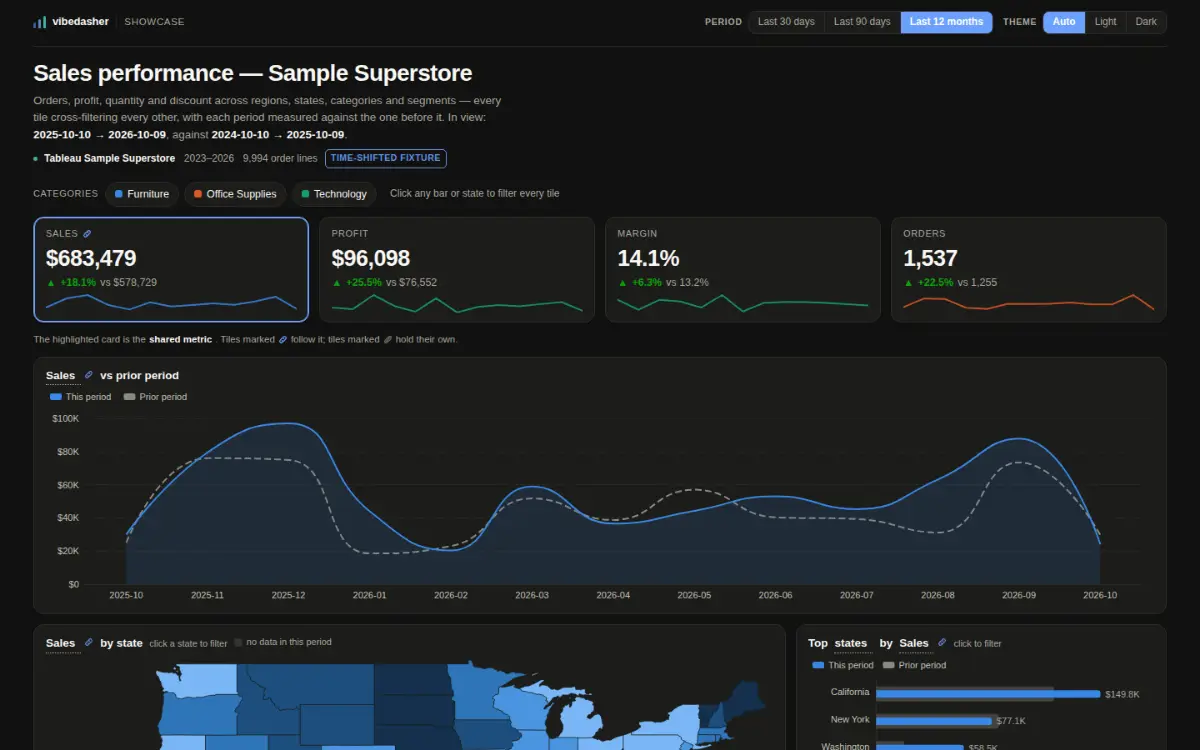
A dark dashboard titled "Sales performance — Sample Superstore", flagged "time-shifted fixture". Four KPI cards with sparklines — sales $682,529 (+17.6%), profit $96,531 (+25.1%), margin 14.1%, orders 1,534 (+22.0%) — each compared with the period before. Under them a filled sales-over-time chart with a dashed prior-period line, and the top of a US state choropleth beside a ranked bar chart led by California at $149.7K.
Linhas no pacote

Sample Superstore, every number against the period before

The one here that does NOT use the query lane. 9,994 order lines ship compiled into the bundle and every tile cross-filters every other. Its wasm extract exists and is never asked for.

  • Varejo
  • Mapas
  • Filtragem cruzada
  • Comparação de períodos
Dados
Tableau Sample Superstore · 2023–2026 · 9,994 order lines
Idade dos dados
em 2027-01-05
Por acesso
450.7 KB no pacote, nada baixado
Publicado por
Vibedasher
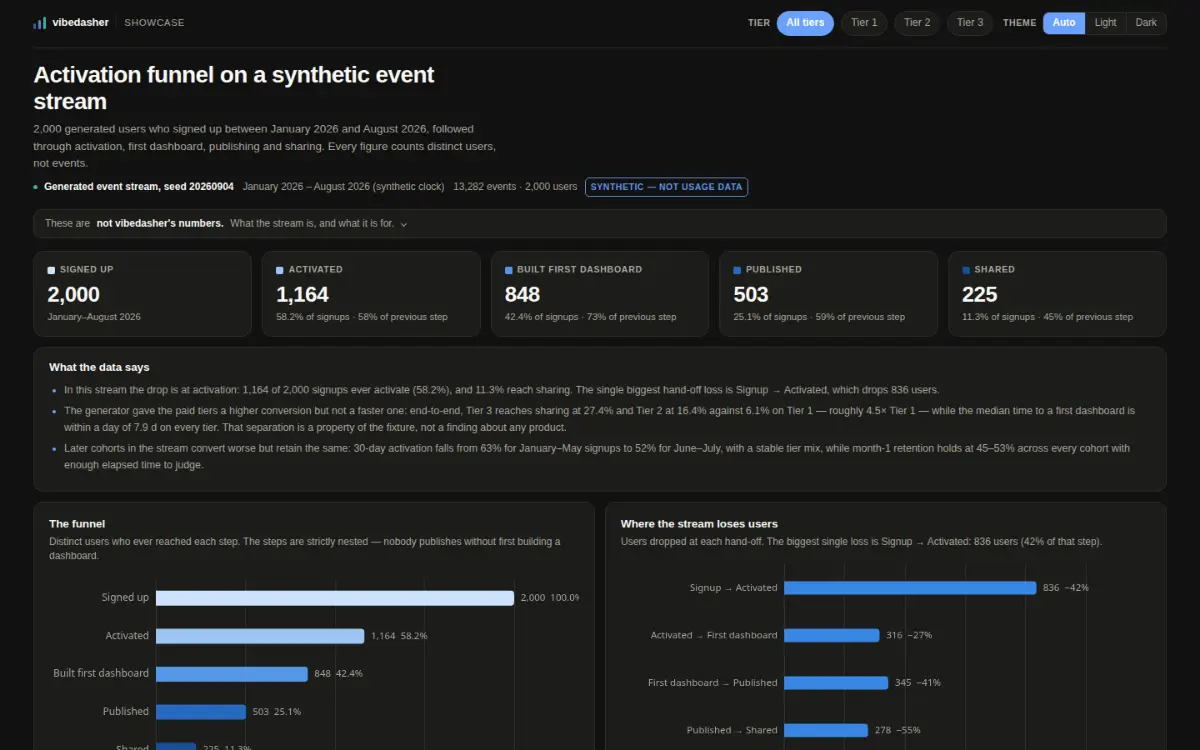
A dark dashboard titled "Activation funnel on a synthetic event stream", flagged "synthetic — not usage data". Five step cards count distinct users: signed up 2,000, activated 1,164 (58.2%), built first dashboard 848, published 503, shared 225. A "what the data says" panel of three findings sits above two bar charts — the nested funnel itself, and the drop at each hand-off, the largest being 836 users lost between signup and activation.
Via de consultaSintético

An activation funnel, on data we made up

SYNTHETIC — the event stream is generated, seed 20260904, and it is not usage data from vibedasher or any real product. Three queries over a 141 KB extract. It is here for the censoring rule; the numbers mean nothing.

  • Produto
Dados
Generated event stream, seed 20260904 · synthetic clock · SYNTHETIC — NOT USAGE DATA
Idade dos dados
em 2026-08-31T23:51:45
Por acesso
137.4 KB baixados, 1 extração
Publicado por
Vibedasher
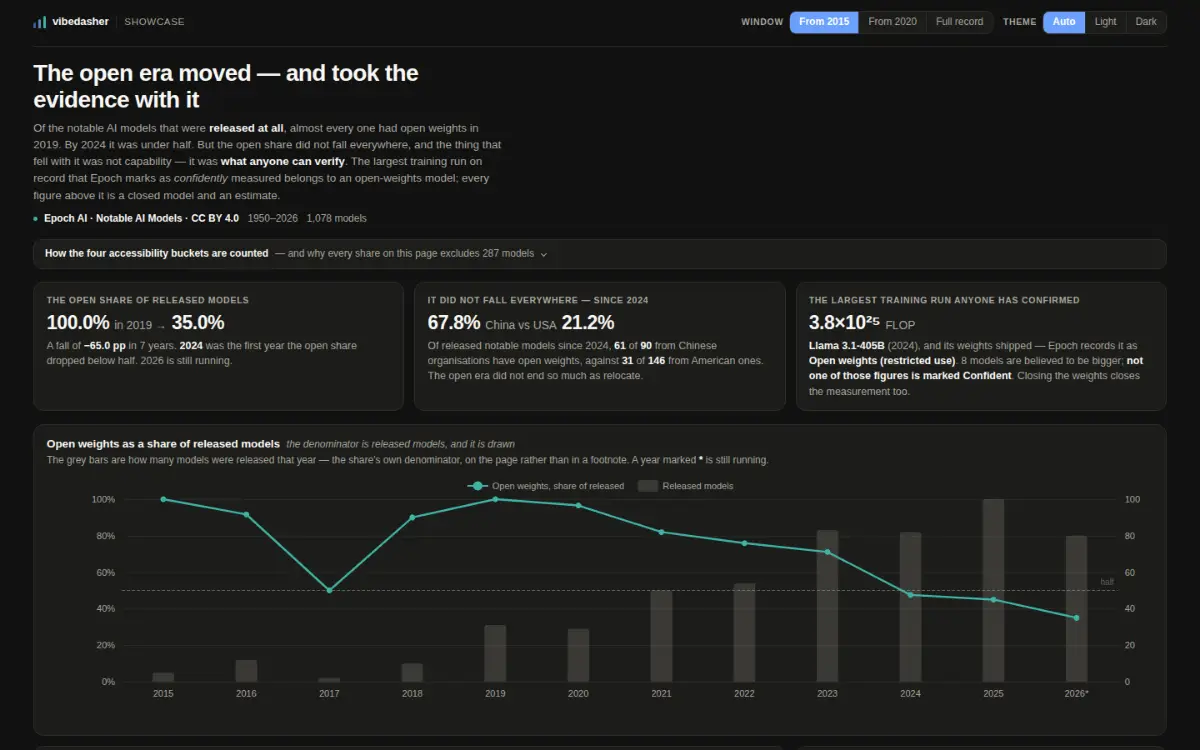
A dashboard titled "The open era moved — and took the evidence with it". Three statistic cards read "the open share of released models" (100.0% in 2019 to 35.0%), "it did not fall everywhere — since 2024" (China 67.8% against the USA’s 21.2%) and "the largest training run anyone has confirmed" (3.8×10²⁵ FLOP, Llama 3.1-405B, open weights). Below them a line chart of the open-weights share by year falling through a dashed "half" line in 2024, with grey bars behind it for the number of models released each year; then a log-scale scatter of every training run coloured by whether the weights are open and faded by how confident the figure is, a list of the eight closed models believed to be bigger than anything confidently measured, country and confidence bar rows, and a median-training-cost chart whose coverage bars collapse after 2023.
Via de consulta

The open era moved — and took the evidence with it

The first dashboard here that is not frozen. A connection-backed Postgres dataset on a daily refresh that rebuilds its wasm extract. It reads as of 2026-09-30, the newest publication date in the rows, and that date moves on its own.

  • IA
  • Atualização agendada
Dados
Epoch AI · Notable AI Models · CC BY 4.0 · 1950–2026 · 1,078 models
Idade dos dados
em 2026-09-30
Por acesso
78.1 KB baixados, 1 extração
Publicado por
Vibedasher
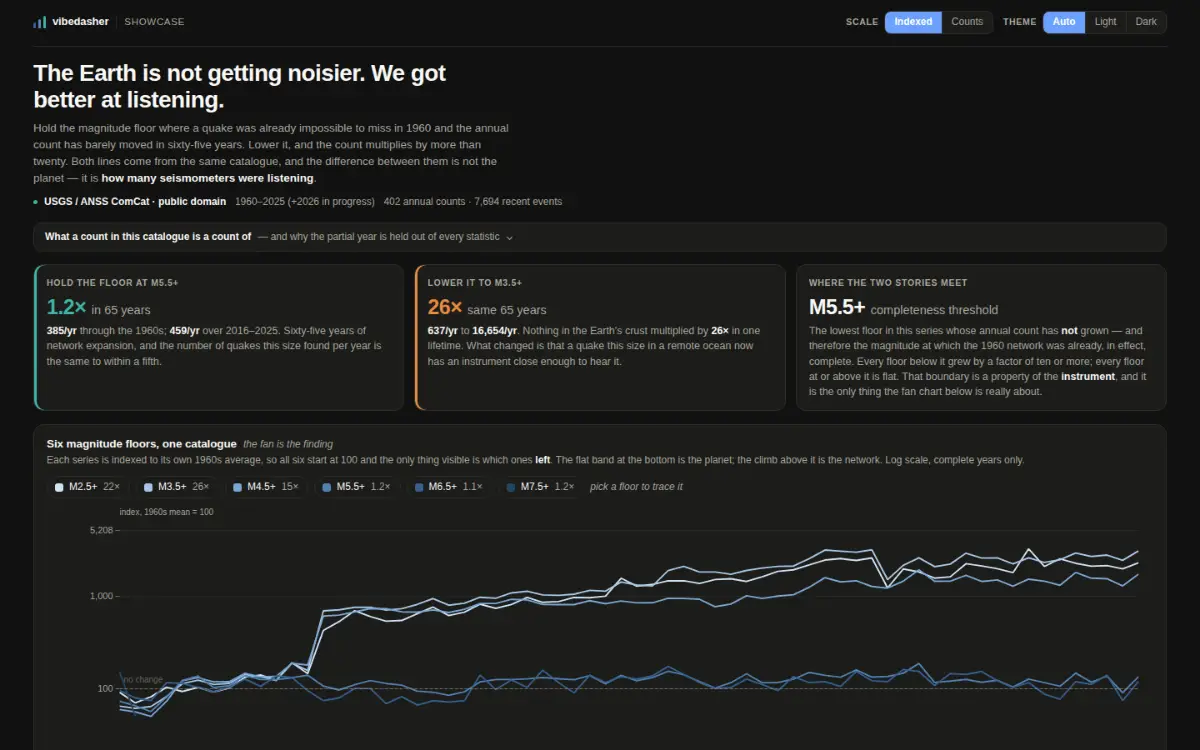
A dashboard titled "The Earth is not getting noisier. We got better at listening." Three statistic cards: holding the floor at M5.5+ gives 1.2× in 65 years (385 events a year in the 1960s against 459 in 2016–2025), lowering it to M3.5+ gives 26× over the same period (637 to 16,654), and the completeness threshold is M5.5+. Below them a log-scale fan chart of six magnitude floors from 1960 to 2025, each indexed to its own 1960s average, with the three low floors climbing away from a flat band of three high ones along a dashed "no change" line; then a table of the same decade rates with ratio bars, a live strip reading 17 events in the last 24 hours, 123 in the last 7 days and 541 in the last 30 with a daily bar chart under it, a magnitude histogram cut off sharply at M4.5, and a ranked list of regions.
Via de consulta

The Earth is not getting noisier. We got better at listening.

Two datasets behind one dashboard, both on a schedule: the long count series daily, the event window every three hours. It reads as of 2026-01-01 because the long series advances once a year; the event tile inside it is hours old.

  • Terra
  • Atualização agendada
Dados
USGS / ANSS ComCat · public domain · 1960–2025 (+2026 in progress) · 402 annual counts · 7,694 recent events
Idade dos dados
em 2026-01-01
Por acesso
307.1 KB baixados, 2 extração
Publicado por
Vibedasher
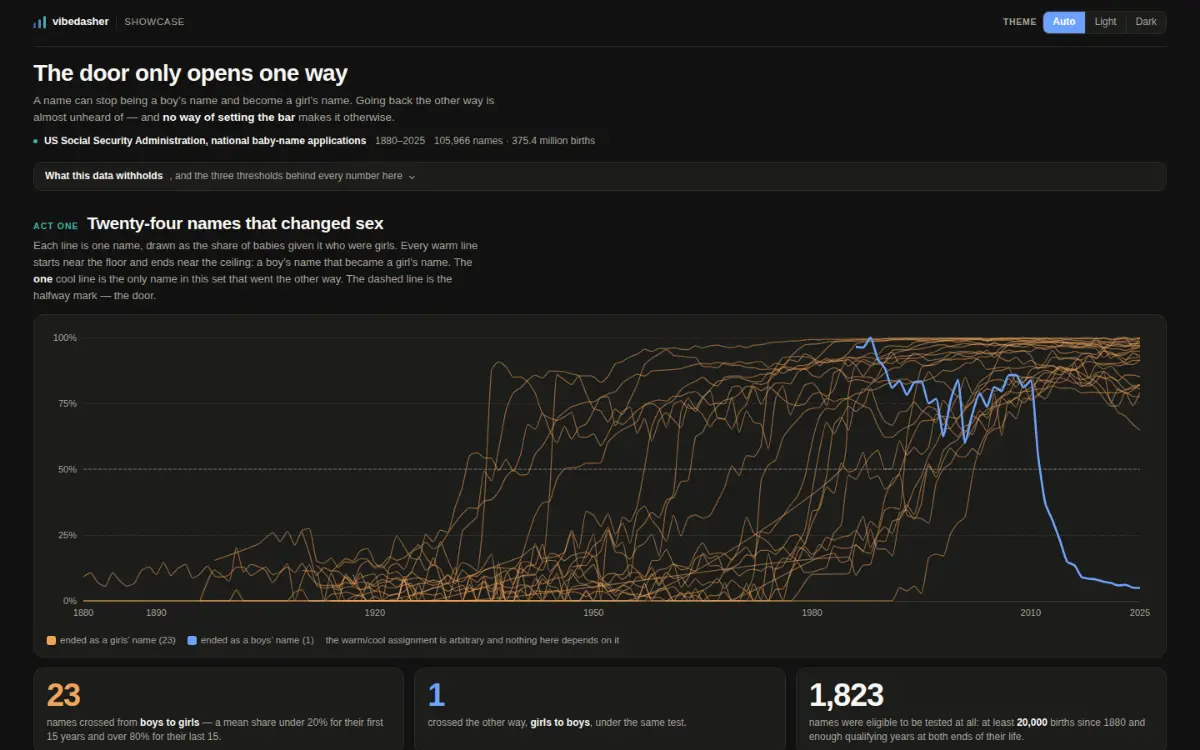
A dashboard titled "The door only opens one way". A line chart spanning 1880 to 2025 plots, for each of twenty-four first names, the share of babies given it who were girls: twenty-three amber lines climb from near 0% to near 100%, and one blue line rides above 75% for decades before falling off a cliff to 5% after 2012. Three statistic cards read 23 names crossed from boys to girls, 1 crossed the other way, and 1,823 names were eligible to be tested. Below, a grid of twenty-four small sparkline cards, one per name, labelled with the year each turned — Shelby 1936 through Kyrie 2012. Then two segmented controls over a six-by-four table showing the same test run at twenty-four different strictness settings, every cell printing a boys-to-girls count beside a girls-to-boys count, and a paired bar chart. Last, a text box where a reader types a name, showing Ashley rising from 0% to 99% girls with its annual birth totals ghosted behind the line.
Via de consulta

The door only opens one way

Three datasets, and only two are fetched when the page opens. The story is told from 62 KB; the 2.1 MB name table that answers "what about my name?" is requested the first time a reader asks and never otherwise.

  • Sociedade
  • Carregamento sob demanda
  • Varredura de parâmetros
Dados
US Social Security Administration, national baby-name applications · public domain (CC0 1.0 via data.gov) · 1880–2025 · 105,966 names · 375,362,447 births
Idade dos dados
em 2025-01-01
Por acesso
2181.5 KB baixados, 3 extração
Publicado por
Vibedasher
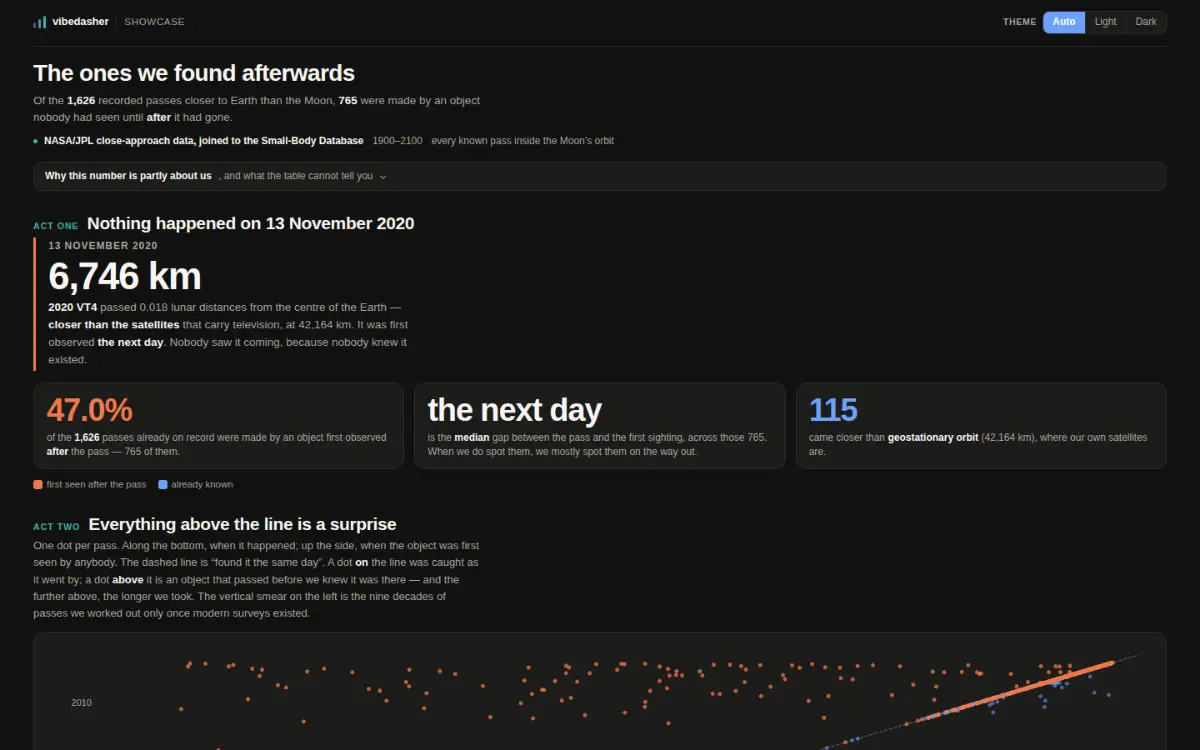
A dashboard titled "The ones we found afterwards". It opens on a date — 13 November 2020 — and a single large figure, 6,746 km, with a note that the asteroid 2020 VT4 passed closer to Earth than geostationary satellites and was first observed the next day. Three statistic cards read 47.0% of recorded passes were made by an object first seen after the pass, "the next day" as the median gap between a pass and its first sighting, and 115 approaches closer than geostationary orbit. Below, a scatter plot with the date of each pass along the bottom and the date the object was first observed up the side, with a dashed diagonal marking "found it the same day": a broad orange band of points sits far above the line across the whole century, while blue points hug the diagonal only at the recent end. A second scatter puts the same passes on a logarithmic distance axis with dashed marks for the Earth’s surface, geostationary orbit and the Moon. Last, a table of the longest gaps — a pass on 19 June 1911 whose object was first seen in 2026, 115 years later.
Via de consulta

The ones we found afterwards

A cron reloads the source table from JPL at 05:40 UTC; the dataset refresh re-reads it at 06:25 and rebuilds the wasm extract. A newly discovered object brings its past approaches with it, so a reload can add a pass from 1911.

  • Espaço
  • Atualização agendada
Dados
NASA/JPL close-approach data joined to the Small-Body Database · US Government work, not subject to copyright · 1900–2100 · 1,697 passes inside the Moon’s orbit
Idade dos dados
em 2026-10-08
Por acesso
115.8 KB baixados, 1 extração
Publicado por
Vibedasher

As análises escritas estão em inglês. Os painéis também não são traduzidos.