Apple, up 44% with a 19% hole in the middle
Apple daily OHLCV, dividend-adjusted · 2015–2017 · 506 trading days
Two years of Apple price data, published public. One query fetches a 33 KB Parquet extract; the window is closed, so the data stays as of 2017-02-16.
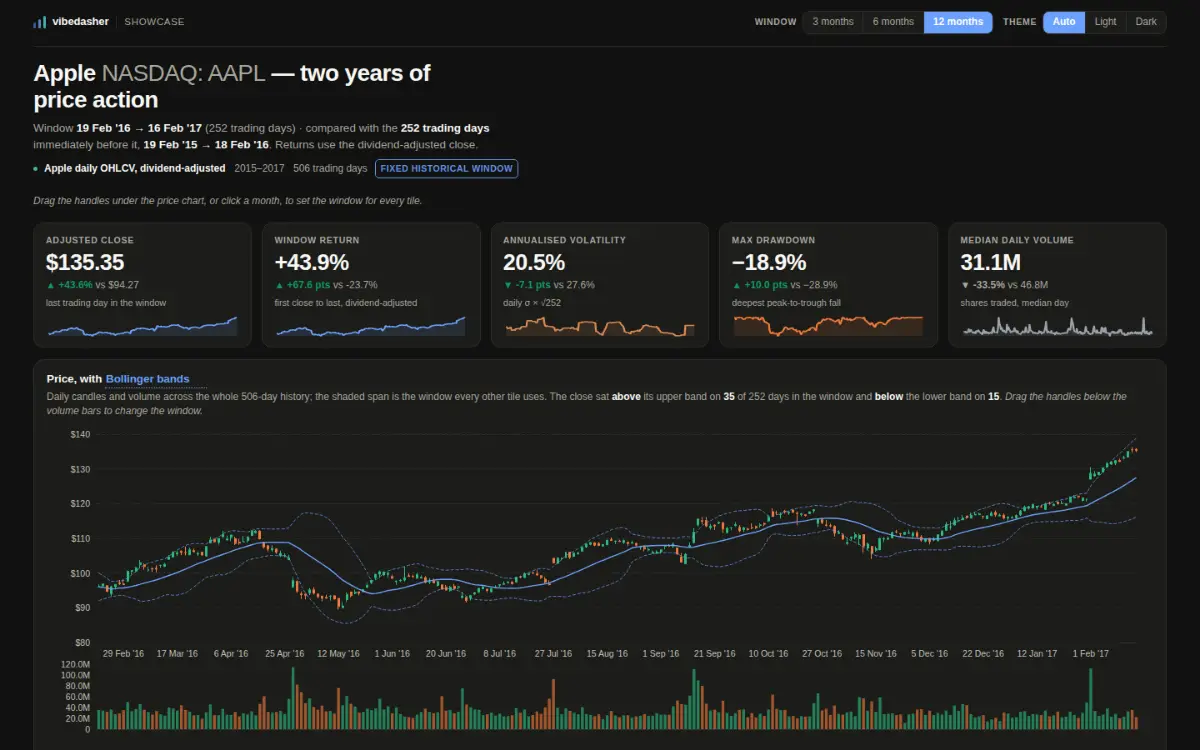
Uma captura de tela do painel publicado, feita a partir do mesmo endereço que qualquer pessoa pode abrir.
- Via de dados
- Via de consulta
- Por acesso
- 33 KB baixados, 1 extração
- Idade dos dados
- em 2017-02-16
- Acessibilidade
- abre sem conta
Medido contra o host em funcionamento, sem nenhuma credencial, em 2026-10-08.
A pergunta que ele responde
Trend, drawdown, the shape of the return distribution, the calendar, and whether volatility was clustering.
Os dados, e de que período
A closed window, loaded once. A demonstration dataset, not a market feed.
Como ele obtém suas linhas
One query, in your browser, with no key.
O que volta
506 rows × 11 columns. Every statistic is derived from them in your browser.
O que foi difícil
Max drawdown is not the low minus the high. It needs a running peak, so a 19% fall from February’s top still counts even though the price later went past it.
O que aconteceu depois da construção
Frozen. A closed two-year window.
O painel em si
Abrir o painel ao vivoO painel carrega do host de visualização. Nada é baixado dele até você pedir, então esta página não toca essa origem sem o seu consentimento.
https://share.vibedasher.com/eu/vibedasher/aapl-two-years-of-price-action?exec=wasm
O que carrega aqui é o painel publicado, do mesmo endereço que qualquer outra pessoa abriria — não uma cópia mantida à mão. A imagem estática acima é uma captura de tela desse mesmo endereço.
Publicado por Vibedasher