Apple, up 44% with a 19% hole in the middle
Apple daily OHLCV, dividend-adjusted · 2015–2017 · 506 trading days
Two years of Apple price data, published public. One query fetches a 33 KB Parquet extract; the window is closed, so the data stays as of 2017-02-16.
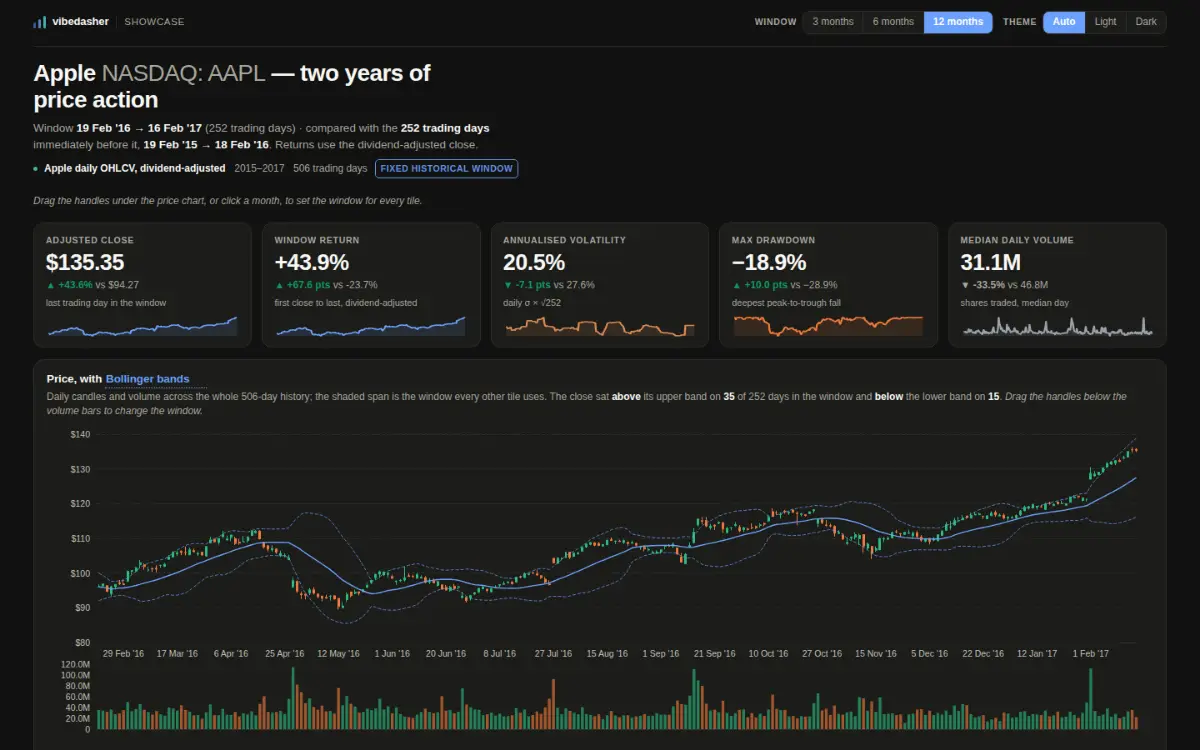
A screenshot of the published dashboard, captured from the same URL anybody can open.
- Data lane
- Query lane
- Per view
- 33 KB fetched, 1 extract
- Data age
- as of 2017-02-16
- Reachability
- opens with no account
Measured against the live host, with no credential, on 2026-10-08.
The question it answers
Trend, drawdown, the shape of the return distribution, the calendar, and whether volatility was clustering.
The data, and over what period
A closed window, loaded once. A demonstration dataset, not a market feed.
How it gets its rows
One query, in your browser, with no key.
What comes back
506 rows × 11 columns. Every statistic is derived from them in your browser.
What was hard
Max drawdown is not the low minus the high. It needs a running peak, so a 19% fall from February’s top still counts even though the price later went past it.
What happened after the build
Frozen. A closed two-year window.
The dashboard itself
Open the live dashboardThe live dashboard loads from the viewer host. Nothing is fetched from it until you ask, so this page does not touch that origin unless you want it to.
https://share.vibedasher.com/eu/vibedasher/aapl-two-years-of-price-action?exec=wasm
What loads here is the published dashboard, from the same address anybody else would open — not a copy kept by hand. The still above it is a screenshot of that same address.
Published by Vibedasher