The Earth is not getting noisier. We got better at listening.
USGS / ANSS ComCat · public domain · 1960–2025 (+2026 in progress) · 402 annual counts · 7,694 recent events
Two datasets behind one dashboard, both on a schedule: the long count series daily, the event window every three hours. It reads as of 2026-01-01 because the long series advances once a year; the event tile inside it is hours old.
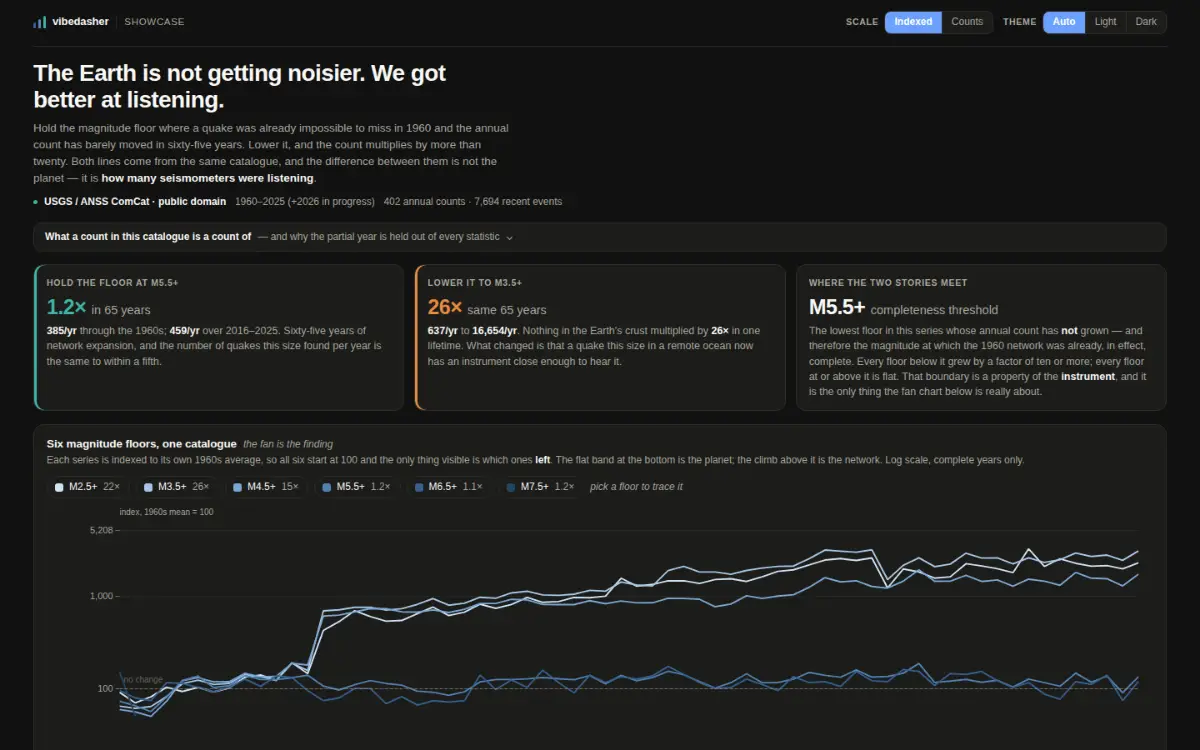
A screenshot of the published dashboard, captured from the same URL anybody can open.
- Data lane
- Query lane
- Per view
- 307.1 KB fetched, 2 extract
- Data age
- as of 2026-01-01
- Reachability
- opens with no account
Measured against the live host, with no credential, on 2026-10-08.
The question it answers
The number of recorded earthquakes has risen for sixty-five years. Is that the planet, or is it us?
The data, and over what period
USGS earthquake catalogue: annual counts at six magnitude floors since 1960, and every M4.5+ event in the last year.
How it gets its rows
Two queries, in your browser, with no key.
What comes back
402 annual counts in 3.8 KB; 7,694 recent events in 310 KB.
What was hard
Below about M5.5 the early decades are incomplete, so comparing raw counts across sixty-five years measures the network rather than the Earth. Six floors are drawn so you can see where that begins.
What happened after the build
Refreshed daily.
The dashboard itself
Open the live dashboardThe live dashboard loads from the viewer host. Nothing is fetched from it until you ask, so this page does not touch that origin unless you want it to.
https://share.vibedasher.com/eu/vibedasher/global-seismicity-1960-2026-the-instrument-not-the-planet?exec=wasm
What loads here is the published dashboard, from the same address anybody else would open — not a copy kept by hand. The still above it is a screenshot of that same address.
Published by Vibedasher