Sample Superstore, every number against the period before
Tableau Sample Superstore · 2023–2026 · 9,994 order lines
The one here that does NOT use the query lane. 9,994 order lines ship compiled into the bundle and every tile cross-filters every other. Its wasm extract exists and is never asked for.
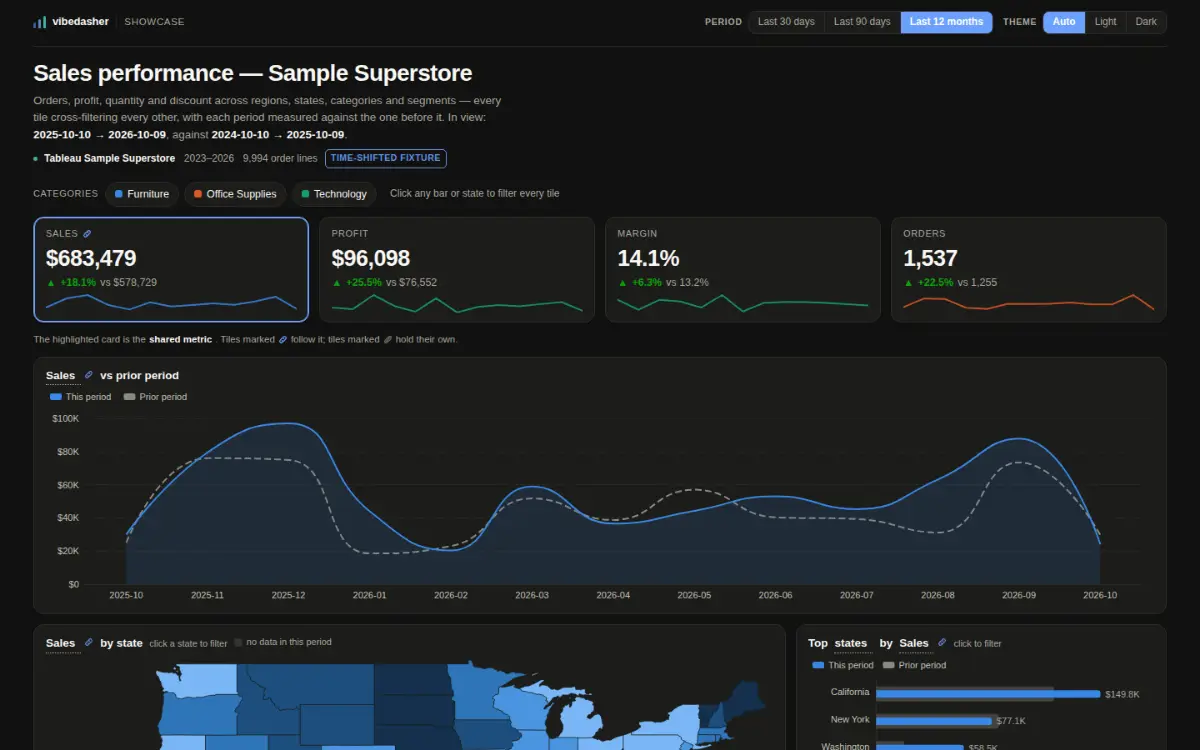
A screenshot of the published dashboard, captured from the same URL anybody can open.
- Data lane
- Rows in the bundle
- Per view
- 450.7 KB shipped in the bundle, nothing fetched
- Data age
- as of 2027-01-05
- Reachability
- opens with no account
Measured against the live host, with no credential, on 2026-10-08.
The question it answers
What does a sales dashboard look like when every tile cross-filters every other and each period is measured against the one before?
The data, and over what period
Tableau’s Sample Superstore — region, state, category and segment. The dates are shifted forward of today, hence the flag.
How it gets its rows
No query at all. The rows are compiled into the bundle and aggregated in memory.
What comes back
Zero result sets. A 461 KB module, resident from first paint.
What was hard
Period-over-period needs both windows to be the same length and to end on the same weekday. Compare a five-weekend month against a four-weekend one and the dashboard reports a trend that is really a calendar artefact.
What happened after the build
Frozen. The shifted dates put the fixture’s last row in the future.
The dashboard itself
Open the live dashboardThe live dashboard loads from the viewer host. Nothing is fetched from it until you ask, so this page does not touch that origin unless you want it to.
https://share.vibedasher.com/eu/vibedasher/sales-performance-superstore-native-build?exec=wasm
What loads here is the published dashboard, from the same address anybody else would open — not a copy kept by hand. The still above it is a screenshot of that same address.
Published by Vibedasher