The ones we found afterwards
NASA/JPL close-approach data joined to the Small-Body Database · US Government work, not subject to copyright · 1900–2100 · 1,697 passes inside the Moon’s orbit
A cron reloads the source table from JPL at 05:40 UTC; the dataset refresh re-reads it at 06:25 and rebuilds the wasm extract. A newly discovered object brings its past approaches with it, so a reload can add a pass from 1911.
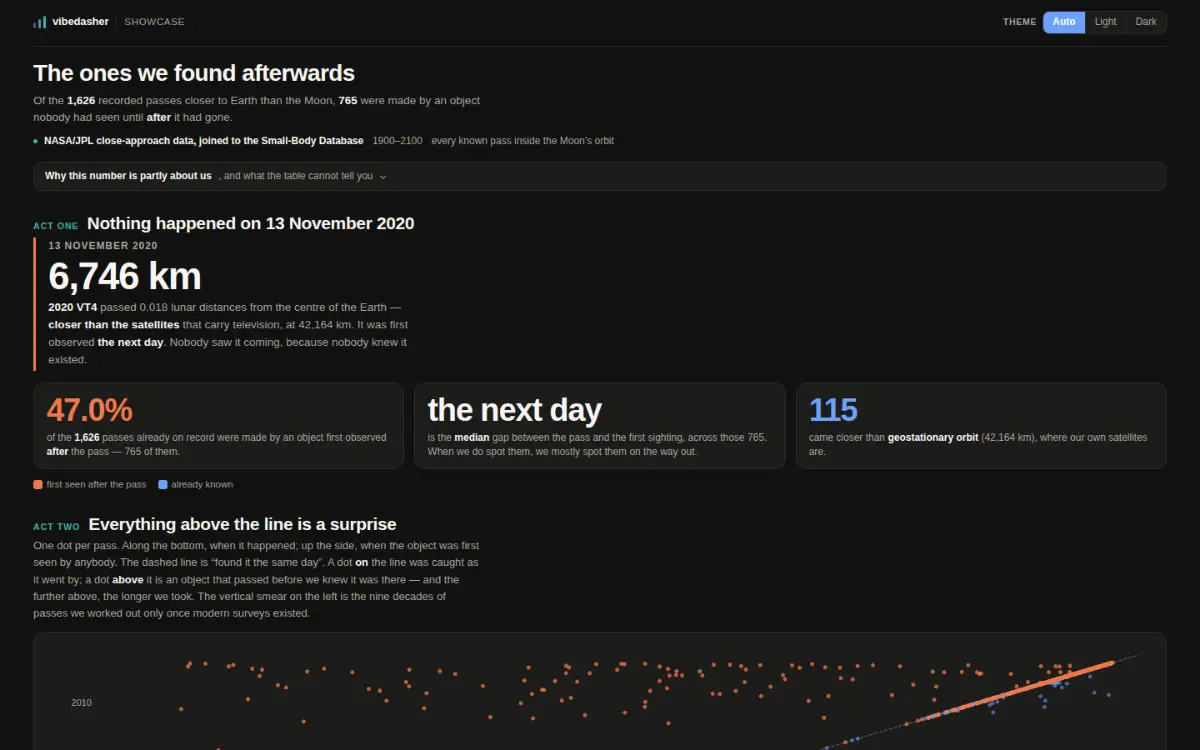
A screenshot of the published dashboard, captured from the same URL anybody can open.
- Data lane
- Query lane
- Per view
- 115.8 KB fetched, 1 extract
- Data age
- as of 2026-10-08
- Reachability
- opens with no account
Measured against the live host, with no credential, on 2026-10-09.
The question it answers
How often does something pass closer to us than the Moon — and did we see it coming?
The data, and over what period
JPL’s close-approach table for every pass inside one lunar distance, joined to the Small-Body Database for when each object was first seen.
How it gets its rows
One query, in your browser, with no key.
What comes back
1,697 rows × 14 columns — one S3 GET, no compute.
What was hard
Distances are measured from the Earth’s centre, so the geostationary ring is 42,164 km and not the 35,786 km altitude. Using the altitude undercounts the passes inside the satellite ring by nineteen.
What happened after the build
Refreshed daily.
The dashboard itself
Open the live dashboardThe live dashboard loads from the viewer host. Nothing is fetched from it until you ask, so this page does not touch that origin unless you want it to.
https://share.vibedasher.com/eu/vibedasher/the-ones-we-found-afterwards?exec=wasm
What loads here is the published dashboard, from the same address anybody else would open — not a copy kept by hand. The still above it is a screenshot of that same address.
Published by Vibedasher