Two centuries of carbon — what the world burned, and who burned it
CDIAC · 1751–2010 · 260 annual observations
Two and a half centuries of fossil-fuel carbon in 5.8 KB, published public, one query over the credential-free lane.
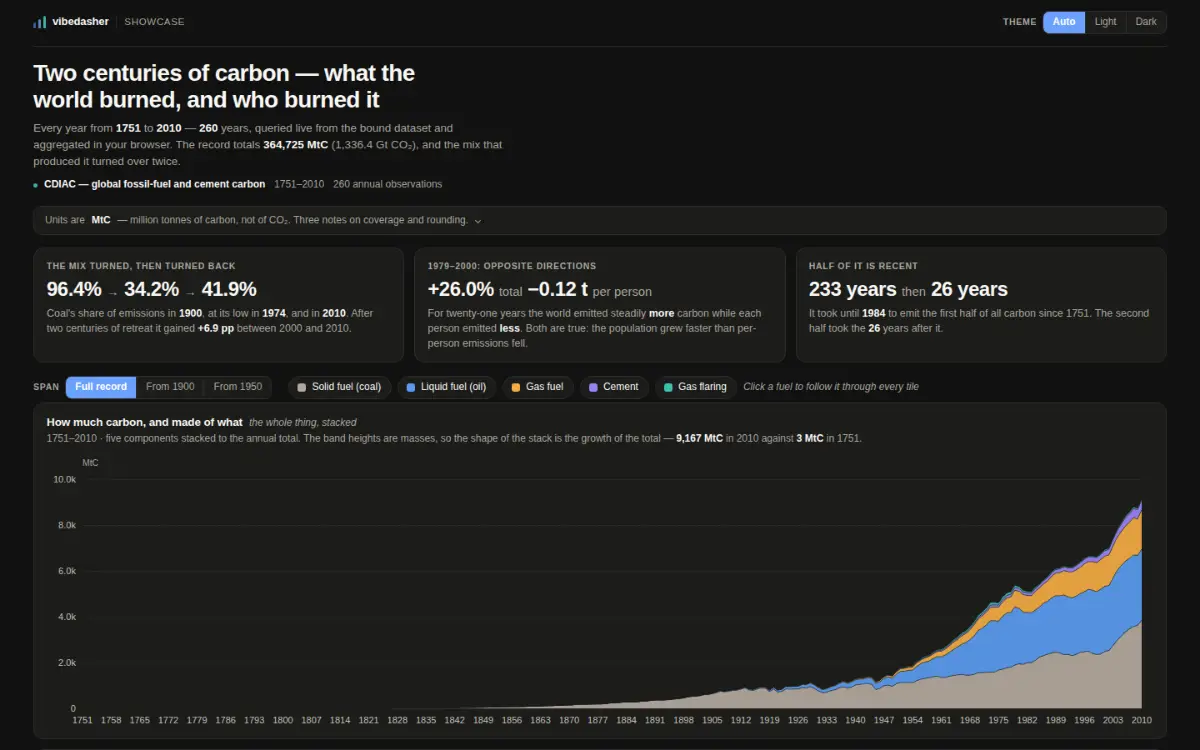
A screenshot of the published dashboard, captured from the same URL anybody can open.
- Data lane
- Query lane
- Per view
- 5.7 KB fetched, 1 extract
- Data age
- the product states none — this dataset has no date column
- Reachability
- opens with no account
Measured against the live host, with no credential, on 2026-10-08.
The question it answers
When did the absolute total and the per-person figure stop telling the same story?
The data, and over what period
Total fossil-fuel carbon, plus solid, liquid and gas fuel, cement, gas flaring and per capita.
How it gets its rows
One query, live, in your browser. The rows arrive when you open the page.
What comes back
260 rows × 8 columns, and every tile comes from it.
What was hard
per_capita is absent before 1950. Coerced to zero it draws a line along the floor for two centuries, so the chart leaves a gap instead.
What happened after the build
Frozen. The record ends in 2010.
The dashboard itself
Open the live dashboardThe live dashboard loads from the viewer host. Nothing is fetched from it until you ask, so this page does not touch that origin unless you want it to.
https://share.vibedasher.com/eu/vibedasher/two-centuries-of-carbon?exec=wasm
What loads here is the published dashboard, from the same address anybody else would open — not a copy kept by hand. The still above it is a screenshot of that same address.
Published by Vibedasher