Growth peaked in 1963, and 37 countries are shrinking
World Bank SP.POP.TOTL · 1960–2024 · 17,195 country-year observations
Sixty-five years of population for every country: a choropleth encoding a rate, circles encoding a count. One query, a 102 KB extract, every tile re-derived when the year scrubber moves.
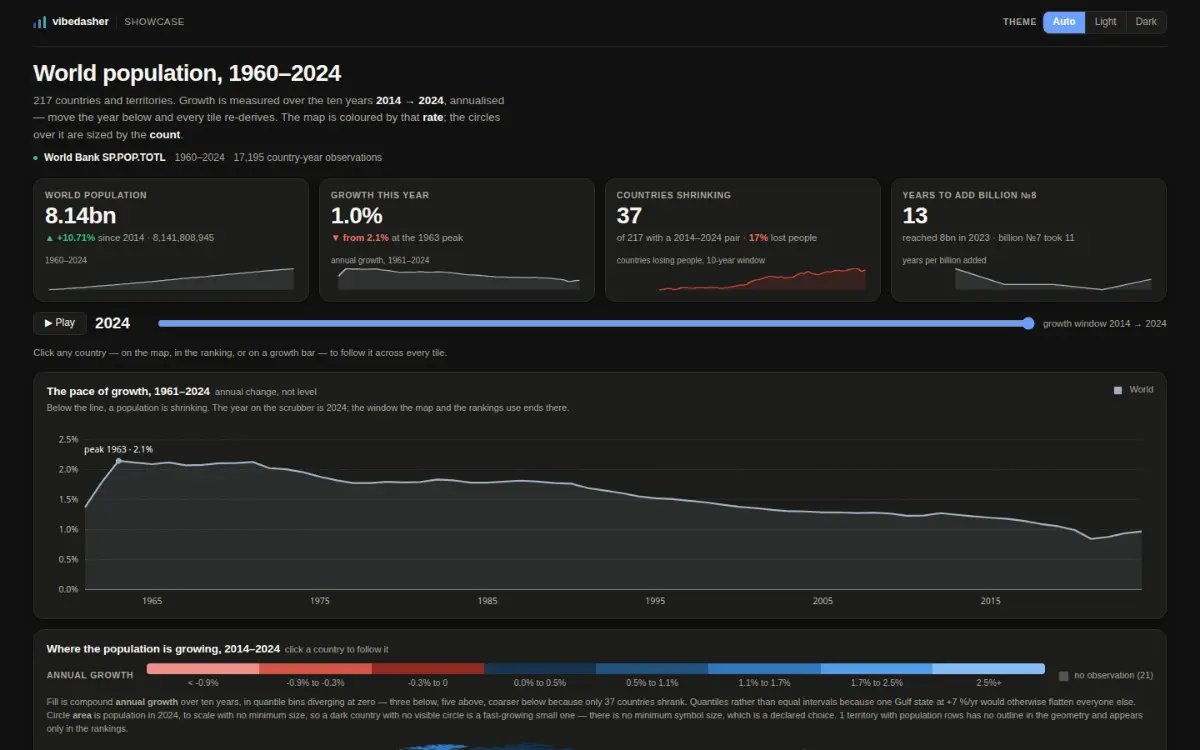
A screenshot of the published dashboard, captured from the same URL anybody can open.
- Data lane
- Query lane
- Per view
- 99.3 KB fetched, 1 extract
- Data age
- the product states none — this dataset has no date column
- Reachability
- opens with no account
Measured against the live host, with no credential, on 2026-10-08.
The question it answers
Who is growing, who is shrinking — and does the rate or the count tell you?
The data, and over what period
Country code, country name, year, value. Nothing else.
How it gets its rows
One query. Moving the year scrubber re-derives every tile in your browser, with no round trip.
What comes back
17,195 rows × 4 columns, in one S3 GET.
What was hard
The fill is annual growth, a rate; the circles are population, a count. One encoding hides the finding, so the two are allowed to disagree.
What happened after the build
Frozen. The World Bank publishes once a year.
The dashboard itself
Open the live dashboardThe live dashboard loads from the viewer host. Nothing is fetched from it until you ask, so this page does not touch that origin unless you want it to.
https://share.vibedasher.com/eu/vibedasher/world-population-1960-2024?exec=wasm
What loads here is the published dashboard, from the same address anybody else would open — not a copy kept by hand. The still above it is a screenshot of that same address.
Published by Vibedasher